<< Chapter < Page Chapter >> Page >

Learning objectives

By the end of this section, you will be able to:

  • Explain what we have learned from our discovery of exoplanets
  • Identify which kind of exoplanets appear to be the most common in the Galaxy
  • Discuss the kinds of planetary systems we are finding around other stars

Before the discovery of exoplanets, most astronomers expected that other planetary systems would be much like our own—planets following roughly circular orbits, with the most massive planets several AU from their parent star. Such systems do exist in large numbers, but many exoplanets and planetary systems are very different from those in our solar system. Another surprise is the existence of whole classes of exoplanets that we simply don’t have in our solar system: planets with masses between the mass of Earth and Neptune, and planets that are several times more massive than Jupiter.

Kepler results

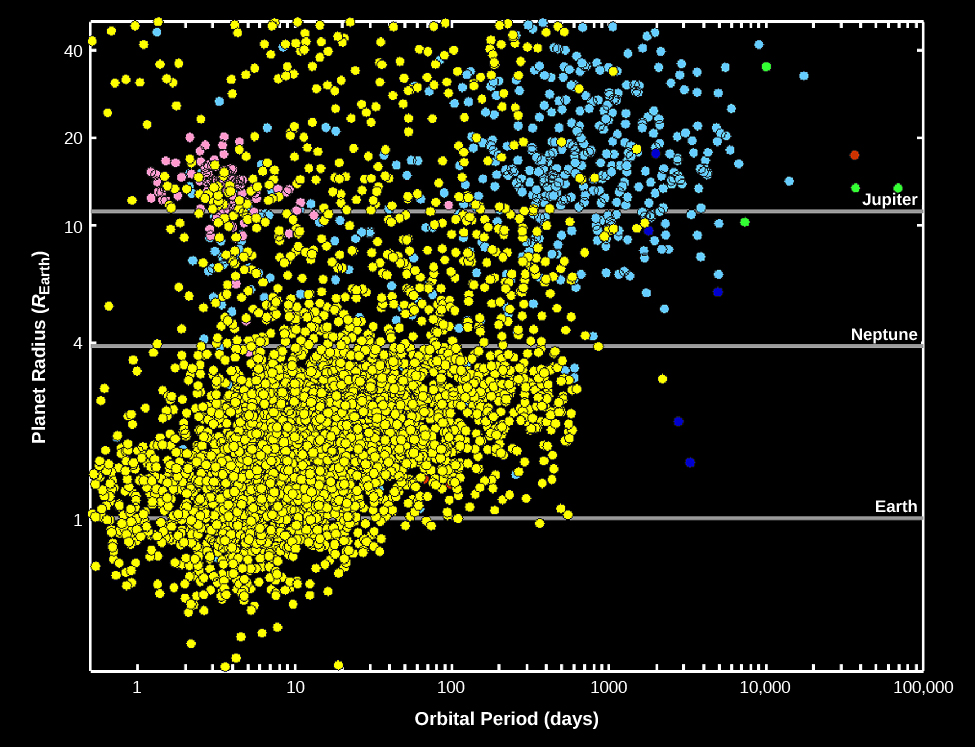
The Kepler telescope has been responsible for the discovery of most exoplanets, especially at smaller sizes, as illustrated in [link] , where the Kepler discoveries are plotted in yellow. You can see the wide range of sizes, including planets substantially larger than Jupiter and smaller than Earth. The absence of Kepler-discovered exoplanets with orbital periods longer than a few hundred days is a consequence of the 4-year lifetime of the mission. (Remember that three evenly spaced transits must be observed to register a discovery.) At the smaller sizes, the absence of planets much smaller than one earth radius is due to the difficulty of detecting transits by very small planets. In effect, the “discovery space” for Kepler was limited to planets with orbital periods less than 400 days and sizes larger than Mars.

Exoplanet discoveries through 2015.

A graph of Exoplanet Discoveries through 2015. The vertical axis is labeled “Planet Radius R sub e”, from 0 to 40 increasing upward, and the horizontal axis is labeled “Orbital Period (days)”, from 1 to 100,000 increasing to the right. Exoplanet discoveries are marked with dots, yellow and red for discoveries by transits, and blue for discoveries by the Doppler technique. The largest concentration of exoplanets discovered by transits is shown from 1 Orbital Period and 1 Planet Radius to 1000 Orbital Period, and 4 Planet Radius. Exoplanets discovered by the Doppler technique are mostly above 4 Planet Radius and are should from 2 to 100,000 Orbital Period. Exoplanet discoveries are predominately on the lefthand side of the graph, extending in a diagonal line upward from the x-axis labeled Orbital Period. Earth is labeled at 1 Planet Radius, Neptune at 4, and Jupiter at 11 for reference.
The vertical axis shows the radius of each planet compared to Earth. Horizontal lines show the size of Earth, Neptune, and Jupiter. The horizontal axis shows the time each planet takes to make one orbit (and is given in Earth days). Recall that Mercury takes 88 days and Earth takes a little more than 365 days to orbit the Sun. The yellow and red dots show planets discovered by transits, and the blue dots are the discoveries by the radial velocity (Doppler) technique. (credit: modification of work by NASA/Kepler mission)

One of the primary objectives of the Kepler mission was to find out how many stars hosted planets and especially to estimate the frequency of earthlike planets. Although Kepler looked at only a very tiny fraction of the stars in the Galaxy, the sample size was large enough to draw some interesting conclusions. While the observations apply only to the stars observed by Kepler, those stars are reasonably representative, and so astronomers can extrapolate to the entire Galaxy.

[link] shows that the Kepler discoveries include many rocky, Earth-size planets, far more than Jupiter-size gas planets. This immediately tells us that the initial Doppler discovery of many hot Jupiters was a biased sample, in effect, finding the odd planetary systems because they were the easiest to detect. However, there is one huge difference between this observed size distribution and that of planets in our solar system. The most common planets have radii between 1.4 and 2.8 that of Earth, sizes for which we have no examples in the solar system. These have been nicknamed super-Earths , while the other large group with sizes between 2.8 and 4 that of Earth are often called mini-Neptunes .

Questions & Answers

differentiate between demand and supply giving examples
Lambiv Reply
differentiated between demand and supply using examples
Lambiv
what is labour ?
Lambiv
how will I do?
Venny Reply
how is the graph works?I don't fully understand
Rezat Reply
information
Eliyee
devaluation
Eliyee
t
WARKISA
hi guys good evening to all
Lambiv
multiple choice question
Aster Reply
appreciation
Eliyee
explain perfect market
Lindiwe Reply
In economics, a perfect market refers to a theoretical construct where all participants have perfect information, goods are homogenous, there are no barriers to entry or exit, and prices are determined solely by supply and demand. It's an idealized model used for analysis,
Ezea
What is ceteris paribus?
Shukri Reply
other things being equal
AI-Robot
When MP₁ becomes negative, TP start to decline. Extuples Suppose that the short-run production function of certain cut-flower firm is given by: Q=4KL-0.6K2 - 0.112 • Where is quantity of cut flower produced, I is labour input and K is fixed capital input (K-5). Determine the average product of lab
Kelo
Extuples Suppose that the short-run production function of certain cut-flower firm is given by: Q=4KL-0.6K2 - 0.112 • Where is quantity of cut flower produced, I is labour input and K is fixed capital input (K-5). Determine the average product of labour (APL) and marginal product of labour (MPL)
Kelo
yes,thank you
Shukri
Can I ask you other question?
Shukri
what is monopoly mean?
Habtamu Reply
What is different between quantity demand and demand?
Shukri Reply
Quantity demanded refers to the specific amount of a good or service that consumers are willing and able to purchase at a give price and within a specific time period. Demand, on the other hand, is a broader concept that encompasses the entire relationship between price and quantity demanded
Ezea
ok
Shukri
how do you save a country economic situation when it's falling apart
Lilia Reply
what is the difference between economic growth and development
Fiker Reply
Economic growth as an increase in the production and consumption of goods and services within an economy.but Economic development as a broader concept that encompasses not only economic growth but also social & human well being.
Shukri
production function means
Jabir
What do you think is more important to focus on when considering inequality ?
Abdisa Reply
any question about economics?
Awais Reply
sir...I just want to ask one question... Define the term contract curve? if you are free please help me to find this answer 🙏
Asui
it is a curve that we get after connecting the pareto optimal combinations of two consumers after their mutually beneficial trade offs
Awais
thank you so much 👍 sir
Asui
In economics, the contract curve refers to the set of points in an Edgeworth box diagram where both parties involved in a trade cannot be made better off without making one of them worse off. It represents the Pareto efficient allocations of goods between two individuals or entities, where neither p
Cornelius
In economics, the contract curve refers to the set of points in an Edgeworth box diagram where both parties involved in a trade cannot be made better off without making one of them worse off. It represents the Pareto efficient allocations of goods between two individuals or entities,
Cornelius
Suppose a consumer consuming two commodities X and Y has The following utility function u=X0.4 Y0.6. If the price of the X and Y are 2 and 3 respectively and income Constraint is birr 50. A,Calculate quantities of x and y which maximize utility. B,Calculate value of Lagrange multiplier. C,Calculate quantities of X and Y consumed with a given price. D,alculate optimum level of output .
Feyisa Reply
Answer
Feyisa
c
Jabir
the market for lemon has 10 potential consumers, each having an individual demand curve p=101-10Qi, where p is price in dollar's per cup and Qi is the number of cups demanded per week by the i th consumer.Find the market demand curve using algebra. Draw an individual demand curve and the market dema
Gsbwnw Reply
suppose the production function is given by ( L, K)=L¼K¾.assuming capital is fixed find APL and MPL. consider the following short run production function:Q=6L²-0.4L³ a) find the value of L that maximizes output b)find the value of L that maximizes marginal product
Abdureman
types of unemployment
Yomi Reply
What is the difference between perfect competition and monopolistic competition?
Mohammed
Got questions? Join the online conversation and get instant answers!
Jobilize.com Reply
Practice Key Terms 2

Get Jobilize Job Search Mobile App in your pocket Now!

Get it on Google Play Download on the App Store Now


Source:  OpenStax, Astronomy. OpenStax CNX. Apr 12, 2017 Download for free at http://cnx.org/content/col11992/1.13
Google Play and the Google Play logo are trademarks of Google Inc.

Notification Switch

Would you like to follow the 'Astronomy' conversation and receive update notifications?

Ask