<< Chapter < Page Chapter >> Page >

Learning objectives

By the end of this section, you will be able to:

  • Explain what we have learned from our discovery of exoplanets
  • Identify which kind of exoplanets appear to be the most common in the Galaxy
  • Discuss the kinds of planetary systems we are finding around other stars

Before the discovery of exoplanets, most astronomers expected that other planetary systems would be much like our own—planets following roughly circular orbits, with the most massive planets several AU from their parent star. Such systems do exist in large numbers, but many exoplanets and planetary systems are very different from those in our solar system. Another surprise is the existence of whole classes of exoplanets that we simply don’t have in our solar system: planets with masses between the mass of Earth and Neptune, and planets that are several times more massive than Jupiter.

Kepler results

The Kepler telescope has been responsible for the discovery of most exoplanets, especially at smaller sizes, as illustrated in [link] , where the Kepler discoveries are plotted in yellow. You can see the wide range of sizes, including planets substantially larger than Jupiter and smaller than Earth. The absence of Kepler-discovered exoplanets with orbital periods longer than a few hundred days is a consequence of the 4-year lifetime of the mission. (Remember that three evenly spaced transits must be observed to register a discovery.) At the smaller sizes, the absence of planets much smaller than one earth radius is due to the difficulty of detecting transits by very small planets. In effect, the “discovery space” for Kepler was limited to planets with orbital periods less than 400 days and sizes larger than Mars.
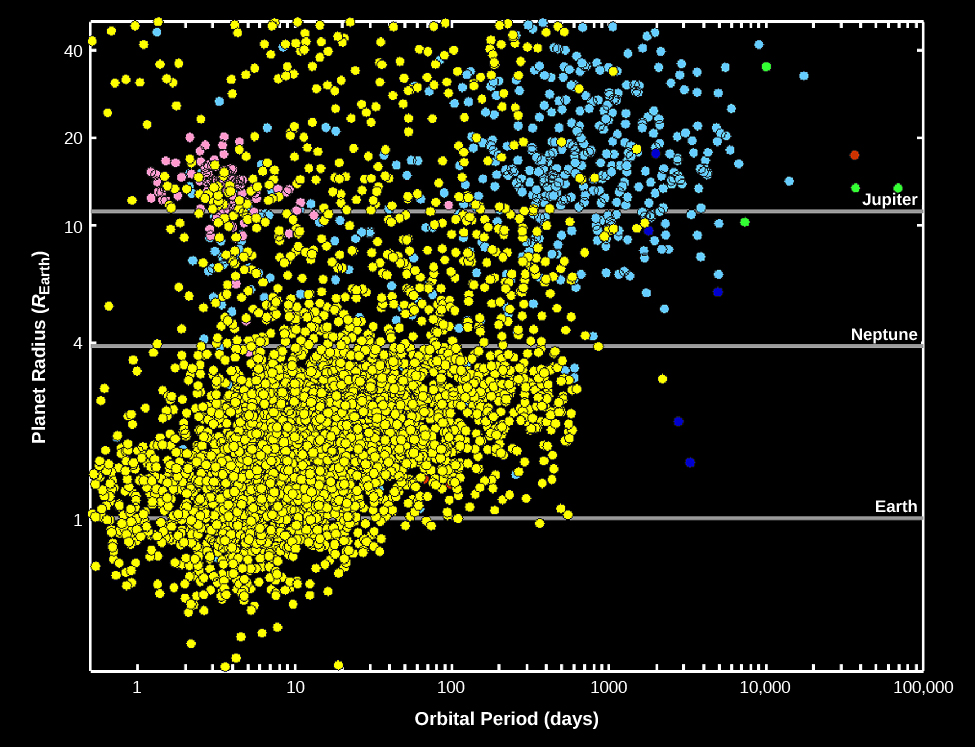
Exoplanet discoveries through 2015.

A graph of Exoplanet Discoveries through 2015. The vertical axis is labeled “Planet Radius R sub e”, from 0 to 40 increasing upward, and the horizontal axis is labeled “Orbital Period (days)”, from 1 to 100,000 increasing to the right. Exoplanet discoveries are marked with dots, yellow and red for discoveries by transits, and blue for discoveries by the Doppler technique. The largest concentration of exoplanets discovered by transits is shown from 1 Orbital Period and 1 Planet Radius to 1000 Orbital Period, and 4 Planet Radius. Exoplanets discovered by the Doppler technique are mostly above 4 Planet Radius and are should from 2 to 100,000 Orbital Period. Exoplanet discoveries are predominately on the lefthand side of the graph, extending in a diagonal line upward from the x-axis labeled Orbital Period. Earth is labeled at 1 Planet Radius, Neptune at 4, and Jupiter at 11 for reference.
The vertical axis shows the radius of each planet compared to Earth. Horizontal lines show the size of Earth, Neptune, and Jupiter. The horizontal axis shows the time each planet takes to make one orbit (and is given in Earth days). Recall that Mercury takes 88 days and Earth takes a little more than 365 days to orbit the Sun. The yellow and red dots show planets discovered by transits, and the blue dots are the discoveries by the radial velocity (Doppler) technique. (credit: modification of work by NASA/Kepler mission)

One of the primary objectives of the Kepler mission was to find out how many stars hosted planets and especially to estimate the frequency of earthlike planets. Although Kepler looked at only a very tiny fraction of the stars in the Galaxy, the sample size was large enough to draw some interesting conclusions. While the observations apply only to the stars observed by Kepler, those stars are reasonably representative, and so astronomers can extrapolate to the entire Galaxy.

[link] shows that the Kepler discoveries include many rocky, Earth-size planets, far more than Jupiter-size gas planets. This immediately tells us that the initial Doppler discovery of many hot Jupiters was a biased sample, in effect, finding the odd planetary systems because they were the easiest to detect. However, there is one huge difference between this observed size distribution and that of planets in our solar system. The most common planets have radii between 1.4 and 2.8 that of Earth, sizes for which we have no examples in the solar system. These have been nicknamed super-Earths , while the other large group with sizes between 2.8 and 4 that of Earth are often called mini-Neptunes .

Questions & Answers

how do you get the 2/50
Abba Reply
number of sport play by 50 student construct discrete data
Aminu Reply
width of the frangebany leaves on how to write a introduction
Theresa Reply
Solve the mean of variance
Veronica Reply
Step 1: Find the mean. To find the mean, add up all the scores, then divide them by the number of scores. ... Step 2: Find each score's deviation from the mean. ... Step 3: Square each deviation from the mean. ... Step 4: Find the sum of squares. ... Step 5: Divide the sum of squares by n – 1 or N.
kenneth
what is error
Yakuba Reply
Is mistake done to something
Vutshila
Hy
anas
hy
What is the life teble
anas
hy
Jibrin
statistics is the analyzing of data
Tajudeen Reply
what is statics?
Zelalem Reply
how do you calculate mean
Gloria Reply
diveving the sum if all values
Shaynaynay
let A1,A2 and A3 events be independent,show that (A1)^c, (A2)^c and (A3)^c are independent?
Fisaye Reply
what is statistics
Akhisani Reply
data collected all over the world
Shaynaynay
construct a less than and more than table
Imad Reply
The sample of 16 students is taken. The average age in the sample was 22 years with astandard deviation of 6 years. Construct a 95% confidence interval for the age of the population.
Aschalew Reply
Bhartdarshan' is an internet-based travel agency wherein customer can see videos of the cities they plant to visit. The number of hits daily is a normally distributed random variable with a mean of 10,000 and a standard deviation of 2,400 a. what is the probability of getting more than 12,000 hits? b. what is the probability of getting fewer than 9,000 hits?
Akshay Reply
Bhartdarshan'is an internet-based travel agency wherein customer can see videos of the cities they plan to visit. The number of hits daily is a normally distributed random variable with a mean of 10,000 and a standard deviation of 2,400. a. What is the probability of getting more than 12,000 hits
Akshay
1
Bright
Sorry i want to learn more about this question
Bright
Someone help
Bright
a= 0.20233 b=0.3384
Sufiyan
a
Shaynaynay
How do I interpret level of significance?
Mohd Reply
It depends on your business problem or in Machine Learning you could use ROC- AUC cruve to decide the threshold value
Shivam
how skewness and kurtosis are used in statistics
Owen Reply
yes what is it
Taneeya
Got questions? Join the online conversation and get instant answers!
Jobilize.com Reply
Practice Key Terms 2

Get Jobilize Job Search Mobile App in your pocket Now!

Get it on Google Play Download on the App Store Now


Source:  OpenStax, Astronomy. OpenStax CNX. Apr 12, 2017 Download for free at http://cnx.org/content/col11992/1.13
Google Play and the Google Play logo are trademarks of Google Inc.

Notification Switch

Would you like to follow the 'Astronomy' conversation and receive update notifications?

Ask