<< Chapter < Page Chapter >> Page >

Learning objectives

By the end of this section, you will be able to:

  • Trace the evolution of dust surrounding a protostar, leading to the development of rocky planets and gas giants
  • Estimate the timescale for growth of planets using observations of the disks surrounding young stars
  • Evaluate evidence for planets around forming stars based on the structures seen in images of the circumstellar dust disks

Having developed on a planet and finding it essential to our existence, we have a special interest in how planets fit into the story of star formation. Yet planets outside the solar system are extremely difficult to detect. Recall that we see planets in our own system only because they reflect sunlight and are close by. When we look to the other stars, we find that the amount of light a planet reflects is a depressingly tiny fraction of the light its star gives off. Furthermore, from a distance, planets are lost in the glare of their much-brighter parent stars.

Disks around protostars: planetary systems in formation

It is a lot easier to detect the spread-out raw material from which planets might be assembled than to detect planets after they are fully formed. From our study of the solar system, we understand that planets form by the gathering together of gas and dust particles in orbit around a newly created star. Each dust particle is heated by the young protostar and radiates in the infrared region of the spectrum. Before any planets form, we can detect such radiation from all of the spread-out individual dust particles that are destined to become parts of planets. We can also detect the silhouette of the disk if it blocks bright light coming from a source behind it ( [link] ).

Disks around protostars.

Four Hubble Space Telescope Images of Disks around Protostars in the Orion Nebula. Each image shows a dark, elliptical shape silhouetted against the bright glowing gas in the background. At the center of each ellipse is a bright reddish spot, indicating the location of the embedded protostar.
These Hubble Space Telescope images show four disks around young stars in the Orion Nebula. The dark, dusty disks are seen silhouetted against the bright backdrop of the glowing gas in the nebula. The size of each image is about 30 times the diameter of our planetary system; this means the disks we see here range in size from two to eight times the orbit of Pluto. The red glow at the center of each disk is a young star, no more than a million years old. These images correspond to the stage in the life of a protostar shown in part (d) of [link] . (credit: modification of work by Mark McCaughrean (Max-Planck-Institute for Astronomy), C. Robert O’Dell (Rice University), and NASA)

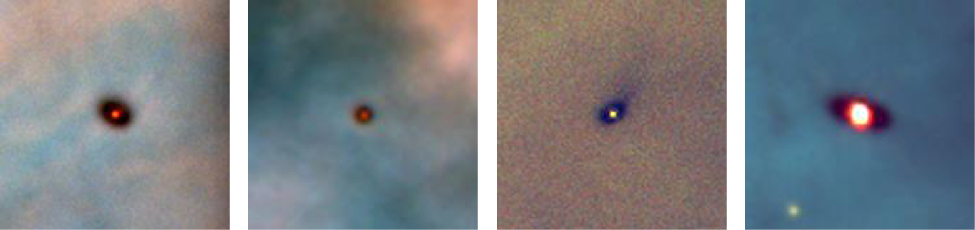
Once the dust particles gather together and form a few planets (and maybe some moons), the overwhelming majority of the dust is hidden in the interiors of the planets where we cannot see it. All we can now detect is the radiation from the outside surfaces, which cover a drastically smaller area than the huge, dusty disk from which they formed. The amount of infrared radiation is therefore greatest before the dust particles combine into planets. For this reason, our search for planets begins with a search for infrared radiation from the material required to make them.

A disk of gas and dust appears to be an essential part of star formation. Observations show that nearly all very young protostars have disks and that the disks range in size from 10 to 1000 AU. (For comparison, the average diameter of the orbit of Pluto, which can be considered the rough size of our own planetary system, is 80 AU, whereas the outer diameter of the Kuiper belt of smaller icy bodies is about 100 AU.) The mass contained in these disks is typically 1–10% of the mass of our own Sun, which is more than the mass of all the planets in our solar system put together. Such observations already demonstrate that a large fraction of stars begin their lives with enough material in the right place to form a planetary system.

Questions & Answers

how do you get the 2/50
Abba Reply
number of sport play by 50 student construct discrete data
Aminu Reply
width of the frangebany leaves on how to write a introduction
Theresa Reply
Solve the mean of variance
Veronica Reply
Step 1: Find the mean. To find the mean, add up all the scores, then divide them by the number of scores. ... Step 2: Find each score's deviation from the mean. ... Step 3: Square each deviation from the mean. ... Step 4: Find the sum of squares. ... Step 5: Divide the sum of squares by n – 1 or N.
kenneth
what is error
Yakuba Reply
Is mistake done to something
Vutshila
Hy
anas
hy
What is the life teble
anas
hy
Jibrin
statistics is the analyzing of data
Tajudeen Reply
what is statics?
Zelalem Reply
how do you calculate mean
Gloria Reply
diveving the sum if all values
Shaynaynay
let A1,A2 and A3 events be independent,show that (A1)^c, (A2)^c and (A3)^c are independent?
Fisaye Reply
what is statistics
Akhisani Reply
data collected all over the world
Shaynaynay
construct a less than and more than table
Imad Reply
The sample of 16 students is taken. The average age in the sample was 22 years with astandard deviation of 6 years. Construct a 95% confidence interval for the age of the population.
Aschalew Reply
Bhartdarshan' is an internet-based travel agency wherein customer can see videos of the cities they plant to visit. The number of hits daily is a normally distributed random variable with a mean of 10,000 and a standard deviation of 2,400 a. what is the probability of getting more than 12,000 hits? b. what is the probability of getting fewer than 9,000 hits?
Akshay Reply
Bhartdarshan'is an internet-based travel agency wherein customer can see videos of the cities they plan to visit. The number of hits daily is a normally distributed random variable with a mean of 10,000 and a standard deviation of 2,400. a. What is the probability of getting more than 12,000 hits
Akshay
1
Bright
Sorry i want to learn more about this question
Bright
Someone help
Bright
a= 0.20233 b=0.3384
Sufiyan
a
Shaynaynay
How do I interpret level of significance?
Mohd Reply
It depends on your business problem or in Machine Learning you could use ROC- AUC cruve to decide the threshold value
Shivam
how skewness and kurtosis are used in statistics
Owen Reply
yes what is it
Taneeya
Got questions? Join the online conversation and get instant answers!
Jobilize.com Reply

Get Jobilize Job Search Mobile App in your pocket Now!

Get it on Google Play Download on the App Store Now


Source:  OpenStax, Astronomy. OpenStax CNX. Apr 12, 2017 Download for free at http://cnx.org/content/col11992/1.13
Google Play and the Google Play logo are trademarks of Google Inc.

Notification Switch

Would you like to follow the 'Astronomy' conversation and receive update notifications?

Ask