Identify the sometimes-violent processes by which parts of a molecular cloud collapse to produce stars
Recognize some of the structures seen in images of
molecular clouds like the one in Orion
Explain how the environment of a molecular cloud enables the formation of stars
Describe how advancing waves of star formation cause a molecular cloud to evolve
As we begin our exploration of how stars are formed, let’s review some basics about stars discussed in earlier chapters:
Stable (main-sequence) stars such as our Sun maintain equilibrium by producing energy through nuclear fusion in their cores. The ability to generate energy by fusion defines a star.
Each second in the Sun, approximately 600 million tons of hydrogen undergo fusion into helium, with about 4 million tons turning into energy in the process. This rate of hydrogen use means that eventually the Sun (and all other stars) will run out of central fuel.
Stars come with many different masses, ranging from 1/12 solar masses (
MSun ) to roughly 100–200
MSun . There are far more low-mass than high-mass stars.
The most massive main-sequence stars (spectral type O) are also the most luminous and have the highest surface temperature. The lowest-mass stars on the main sequence (spectral type M or L) are the least luminous and the coolest.
A galaxy of stars such as the Milky Way contains enormous amounts of gas and dust—enough to make billions of stars like the Sun.
If we want to find stars still in the process of formation, we must look in places that have plenty of the raw material from which stars are assembled. Since stars are made of gas, we focus our attention (and our telescopes) on the dense and cold clouds of gas and dust that dot the Milky Way (see
[link] and
[link] ).
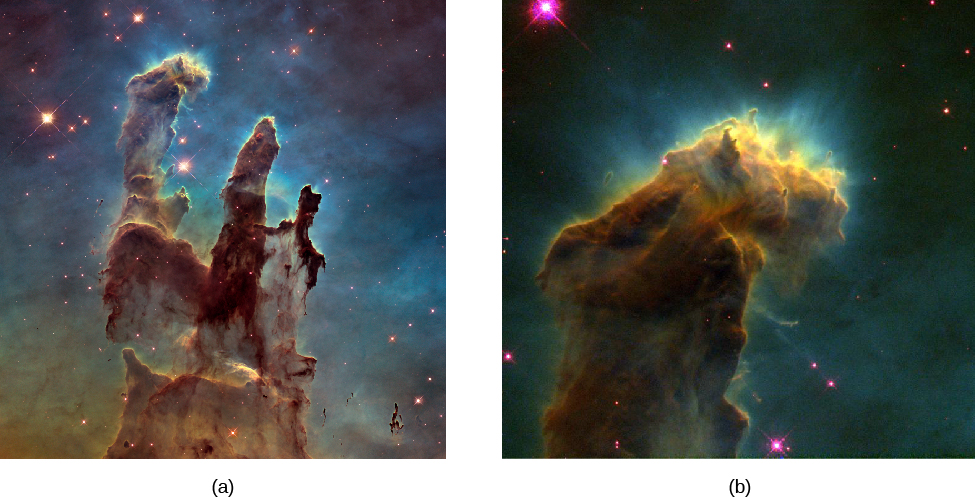
Pillars of dust and dense globules in m16.
(a) This Hubble Space Telescope image of the central regions of M16 (also known as the
Eagle Nebula ) shows huge columns of cool gas, (including molecular hydrogen, H2) and dust. These columns are of higher density than the surrounding regions and have resisted evaporation by the ultraviolet radiation from a cluster of hot stars just beyond the upper-right corner of this image. The tallest pillar is about 1 light-year long, and the M16 region is about 7000 light-years away from us. (b) This close-up view of one of the pillars shows some very dense globules, many of which harbor embryonic stars. Astronomers coined the term
evaporating gas globules (EGGs) for these structures, in part so that they could say we found EGGs inside the Eagle Nebula. It is possible that because these EGGs are exposed to the relentless action of the radiation from nearby hot stars, some may not yet have collected enough material to form a star. (credit a : modification of work by NASA, ESA, and the Hubble Heritage Team (STScI/AURA); credit b: modification of work by NASA, ESA, STScI, J. Hester and P. Scowen (Arizona State University))
Molecular clouds: stellar nurseries
As we saw in
Between the Stars: Gas and Dust in Space , the most massive reservoirs of interstellar matter—and some of the most massive objects in the Milky Way Galaxy—are the
giant molecular clouds . These clouds have cold interiors with characteristic temperatures of only 10–20 K; most of their gas atoms are bound into molecules. These clouds turn out to be the birthplaces of most stars in our Galaxy.
Step 1: Find the mean. To find the mean, add up all the scores, then divide them by the number of scores. ...
Step 2: Find each score's deviation from the mean. ...
Step 3: Square each deviation from the mean. ...
Step 4: Find the sum of squares. ...
Step 5: Divide the sum of squares by n – 1 or N.
The sample of 16 students is taken. The average age in the sample was 22 years with astandard deviation of 6 years. Construct a 95% confidence interval for the age of the population.
Bhartdarshan' is an internet-based travel agency wherein customer can see videos of the cities they plant to visit. The number of hits daily is a normally distributed random variable with a mean of 10,000 and a standard deviation of 2,400
a. what is the probability of getting more than 12,000 hits?
b. what is the probability of getting fewer than 9,000 hits?
Bhartdarshan'is an internet-based travel agency wherein customer can see videos of the cities they plan to visit. The number of hits daily is a normally distributed random variable with a mean of 10,000 and a standard deviation of 2,400.
a. What is the probability of getting more than 12,000 hits