<< Chapter < Page Chapter >> Page >

Learning objectives

By the end of this section, you will be able to:

  • Explain how much interstellar matter there is in the Milky Way, and what its typical density is
  • Describe how the interstellar medium is divided into gaseous and solid components

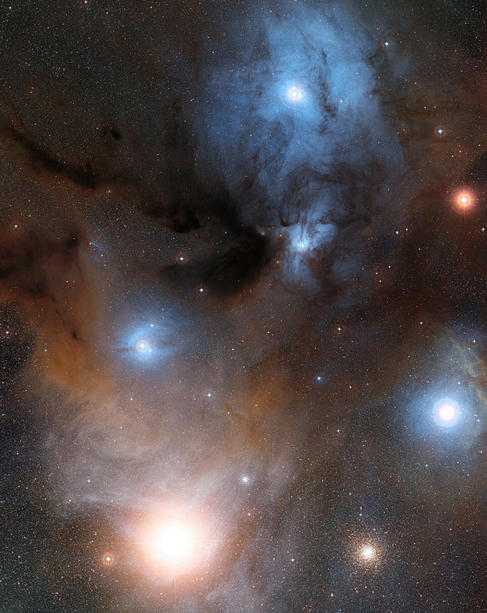
Astronomers refer to all the material between stars as interstellar matter; the entire collection of interstellar matter is called the interstellar medium (ISM)    . Some interstellar material is concentrated into giant clouds, each of which is known as a nebula    (plural “nebulae,” Latin for “clouds”). The best-known nebulae are the ones that we can see glowing or reflecting visible light; there are many pictures of these in this chapter.

Interstellar clouds do not last for the lifetime of the universe. Instead, they are like clouds on Earth, constantly shifting, merging with each other, growing, or dispersing. Some become dense and massive enough to collapse under their own gravity, forming new stars. When stars die, they, in turn, eject some of their material into interstellar space. This material can then form new clouds and begin the cycle over again.

About 99% of the material between the stars is in the form of a gas —that is, it consists of individual atoms or molecules. The most abundant elements in this gas are hydrogen and helium (which we saw are also the most abundant elements in the stars), but the gas also includes other elements. Some of the gas is in the form of molecules—combinations of atoms. The remaining 1% of the interstellar material is solid—frozen particles consisting of many atoms and molecules that are called interstellar grains or interstellar dust    ( [link] ). A typical dust grain consists of a core of rocklike material (silicates) or graphite surrounded by a mantle of ices; water, methane, and ammonia are probably the most abundant ices.

Various types of interstellar matter.

Various Types of Interstellar Matter. Antares, the brightest star in the constellation Scorpio, is at lower left in this wide-field image. It is surrounded by reddish nebulosity. To the right of Antares is the globular cluster M4. At center left a bright star is surrounded by the blue glow of a reflection nebula, and at center right another bright star is surrounded by red nebulosity. Above these two stars a dark nebula snakes its way across the image, blocking the light from behind. Finally, at top center, a bright star is surrounded by a large area of blue reflection nebulosity, criss-crossed by dark dust lanes.
The reddish nebulae in this spectacular photograph glow with light emitted by hydrogen atoms. The darkest areas are clouds of dust that block the light from stars behind them. The upper part of the picture is filled with the bluish glow of light reflected from hot stars embedded in the outskirts of a huge, cool cloud of dust and gas. The cool supergiant star Antares can be seen as a big, reddish patch in the lower-left part of the picture. The star is shedding some of its outer atmosphere and is surrounded by a cloud of its own making that reflects the red light of the star. The red nebula in the middle right partially surrounds the star Sigma Scorpii. (To the right of Antares, you can see M4, a much more distant cluster of extremely old stars.) (credit: modification of work by ESO/Digitized Sky Survey 2)

If all the interstellar gas within the Galaxy were spread out smoothly, there would be only about one atom of gas per cm 3 in interstellar space. (In contrast, the air in the room where you are reading this book has roughly 10 19 atoms per cm 3 .) The dust grains are even scarcer. A km 3 of space would contain only a few hundred to a few thousand tiny grains, each typically less than one ten-thousandth of a millimeter in diameter. These numbers are just averages, however, because the gas and dust are distributed in a patchy and irregular way, much as water vapor in Earth’s atmosphere is often concentrated into clouds.

Questions & Answers

how do you get the 2/50
Abba Reply
number of sport play by 50 student construct discrete data
Aminu Reply
width of the frangebany leaves on how to write a introduction
Theresa Reply
Solve the mean of variance
Veronica Reply
Step 1: Find the mean. To find the mean, add up all the scores, then divide them by the number of scores. ... Step 2: Find each score's deviation from the mean. ... Step 3: Square each deviation from the mean. ... Step 4: Find the sum of squares. ... Step 5: Divide the sum of squares by n – 1 or N.
kenneth
what is error
Yakuba Reply
Is mistake done to something
Vutshila
Hy
anas
hy
What is the life teble
anas
hy
Jibrin
statistics is the analyzing of data
Tajudeen Reply
what is statics?
Zelalem Reply
how do you calculate mean
Gloria Reply
diveving the sum if all values
Shaynaynay
let A1,A2 and A3 events be independent,show that (A1)^c, (A2)^c and (A3)^c are independent?
Fisaye Reply
what is statistics
Akhisani Reply
data collected all over the world
Shaynaynay
construct a less than and more than table
Imad Reply
The sample of 16 students is taken. The average age in the sample was 22 years with astandard deviation of 6 years. Construct a 95% confidence interval for the age of the population.
Aschalew Reply
Bhartdarshan' is an internet-based travel agency wherein customer can see videos of the cities they plant to visit. The number of hits daily is a normally distributed random variable with a mean of 10,000 and a standard deviation of 2,400 a. what is the probability of getting more than 12,000 hits? b. what is the probability of getting fewer than 9,000 hits?
Akshay Reply
Bhartdarshan'is an internet-based travel agency wherein customer can see videos of the cities they plan to visit. The number of hits daily is a normally distributed random variable with a mean of 10,000 and a standard deviation of 2,400. a. What is the probability of getting more than 12,000 hits
Akshay
1
Bright
Sorry i want to learn more about this question
Bright
Someone help
Bright
a= 0.20233 b=0.3384
Sufiyan
a
Shaynaynay
How do I interpret level of significance?
Mohd Reply
It depends on your business problem or in Machine Learning you could use ROC- AUC cruve to decide the threshold value
Shivam
how skewness and kurtosis are used in statistics
Owen Reply
yes what is it
Taneeya
Got questions? Join the online conversation and get instant answers!
Jobilize.com Reply
Practice Key Terms 3

Get Jobilize Job Search Mobile App in your pocket Now!

Get it on Google Play Download on the App Store Now


Source:  OpenStax, Astronomy. OpenStax CNX. Apr 12, 2017 Download for free at http://cnx.org/content/col11992/1.13
Google Play and the Google Play logo are trademarks of Google Inc.

Notification Switch

Would you like to follow the 'Astronomy' conversation and receive update notifications?

Ask