<< Chapter < Page Chapter >> Page >

Photons deep in the sun.

Diagram of the Motion of Photons Deep in the Sun. The dense gas of the Solar interior is shown as a fairly uniform scattering of yellow dots. A photon is drawn as a wavy black arrow moving upward from the bottom of the figure. The point of this arrow touches one of the yellow dots, from which another wavy arrow is drawn moving towards the upper left. This second arrow touches another yellow dot from which a third wavy arrow is drawn moving toward the upper right. This third arrow touches another yellow dot from which a fourth wavy arrow is drawn moving toward lower right. This fourth arrow touches another yellow dot from which a fifth arrow is drawn moving horizontally to the right. This fifth arrow strikes another yellow dot from which a sixth and final wavy arrow is drawn moving toward upper left and touches another yellow dot.
A photon moving through the dense gases in the solar interior travels only a short distance before it interacts with one of the surrounding atoms. The photon usually has a lower energy after each interaction and may then travel in any random direction.

Photon and neutrino paths in the sun.

Diagram of Photon and Neutrino Paths in the Sun. At left, (a) shows the Sun as a yellow disk. Starting at the center of the Sun, the path of a photon is drawn in red and labeled “Photon”. The photon path zigzags, curves and twists back on itself many, many times before reaching the Sun’s surface and then travels away into space in a straight line. At right, (b) also shows the Sun as a yellow disk. Starting at the center of the Sun the path of a neutrino is drawn in blue and labeled “Neutrino”. The neutrino path is a straight line from the center to the surface and outward into space.
(a) Because photons generated by fusion reactions in the solar interior travel only a short distance before being absorbed or scattered by atoms and sent off in random directions, estimates are that it takes between 100,000 and 1,000,000 years for energy to make its way from the center of the Sun to its surface. (b) In contrast, neutrinos do not interact with matter but traverse straight through the Sun at the speed of light, reaching the surface in only a little more than 2 seconds.

Heat transfer and cooking

The three ways that heat energy moves from higher-temperature regions to cooler regions are all used in cooking, and this is important to all of us who enjoy making or eating food.

Conduction is heat transfer by physical contact during which the energetic motion of particles in one region spread to other regions and even to adjacent objects in close contact. A tasty example of this is cooking a steak on a hot iron skillet. When a flame makes the bottom of a skillet hot, the particles in it vibrate actively and collide with neighboring particles, spreading the heat energy throughout the skillet (the ability to spread heat uniformly is a key criterion for selecting materials for cookware). A steak sitting on the surface of the skillet picks up heat energy by the particles in the surface of the skillet colliding with particles on the surface of the steak. Many cooks will put a little oil on the pan, and this layer of oil, besides preventing sticking, increases heat transfer by filling in gaps and increasing the contact surface area.

Convection is heat transfer by the motion of matter that rises because it is hot and less dense. Heating a fluid makes it expand, which makes it less dense, so it rises. An oven is a great example of this: the fire is at the bottom of the oven and heats the air down there, causing it to expand (becoming less dense), so it rises up to where the food is. The rising hot air carries the heat from the fire to the food by convection. This is how conventional ovens work. You may also be familiar with convection    ovens that use a fan to circulate hot air for more even cooking. A scientist would object to that name because normal non-fan ovens that rely on hot air rising to circulate the heat are convection ovens; technically, the ovens that use fans to help move heat are “advection” ovens. (You may not have heard about this because the scientists who complain loudly about misusing the terms convection and advection don’t get out much.)

Radiation is the transfer of heat energy by electromagnetic radiation. Although microwave ovens are an obvious example of using radiation to heat food, a simpler example is a toy oven. Toy ovens are powered by a very bright light bulb. The child-chefs prepare a mix for brownies or cookies, put it into a tray, and place it in the toy oven under the bright light bulb. The light and heat from the bulb hit the brownie mix and cook it. If you have ever put your hand near a bright light, you have undoubtedly noticed your hand getting warmed by the light.

Model stars

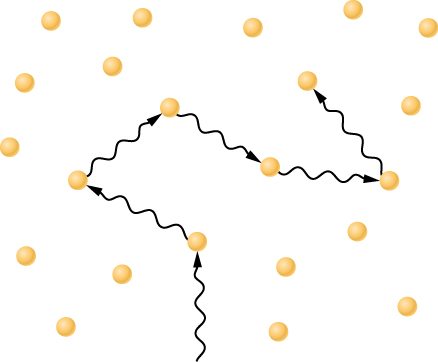
Scientists use the principles we have just described to calculate what the Sun’s interior is like. These physical ideas are expressed as mathematical equations that are solved to determine the values of temperature, pressure, density, the efficiency with which photons are absorbed, and other physical quantities throughout the Sun. The solutions obtained, based on a specific set of physical assumptions, provide a theoretical model for the interior of the Sun.

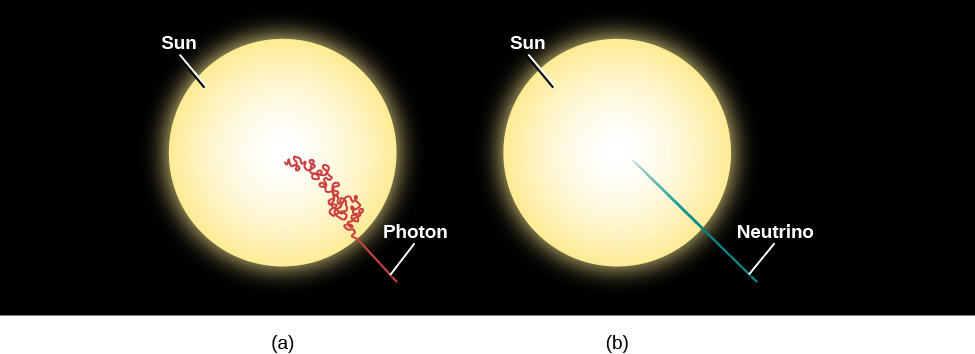
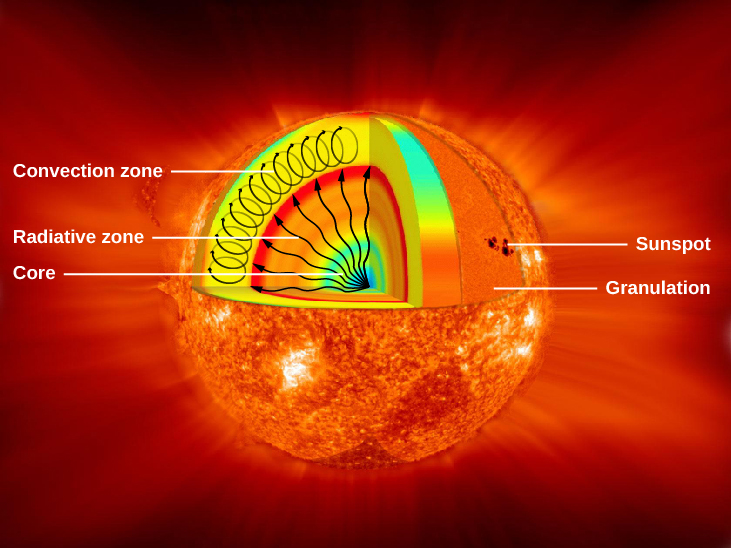
[link] schematically illustrates the predictions of a theoretical model for the Sun’s interior. Energy is generated through fusion in the core of the Sun, which extends only about one-quarter of the way to the surface but contains about one-third of the total mass of the Sun. At the center, the temperature reaches a maximum of approximately 15 million K, and the density is nearly 150 times that of water. The energy generated in the core is transported toward the surface by radiation until it reaches a point about 70% of the distance from the center to the surface. At this point, convection begins, and energy is transported the rest of the way, primarily by rising columns of hot gas.

Interior structure of the sun.

Interior Structure of the Sun. In this cutaway illustration of the Sun, a triangular wedge shaped portion has been removed from the upper half to expose the interior, with surface features shown in the lower half of the diagram. Interior features are labeled on the left hand side of the figure. In the interior, the core is labeled and drawn in blue. Next, the radiative zone is labeled and drawn as a gradient of color starting with yellow just outside the core, to orange and finally red marking the upper boundary. Several wavy arrows are drawn from the center of the core out to the red boundary of the radiative zone, representing the energy leaving the core and moving through the radiative zone. The convection zone is drawn as a thick yellow layer above the radiative zone. Oval arrows are drawn within the convection zone to indicate the vertical motion of the gas. Surface features are labeled on the right had side of the figure. Two surface features are labeled, granulation and a sunspot.
Energy is generated in the core by the fusion of hydrogen to form helium. This energy is transmitted outward by radiation—that is, by the absorption and reemission of photons. In the outermost layers, energy is transported mainly by convection. (credit: modification of work by NASA/Goddard)

[link] shows how the temperature, density, rate of energy generation, and composition vary from the center of the Sun to its surface.

Interior of the sun.

Interior of the Sun in Four Graphs. The horizontal scale for all four graphs is the fraction of the Sun’s radius, and goes from zero on the left to 1.0 on the right. At the top of all four graphs the three principal regions of the Sun’s interior are labeled and presented in different background colors. At left the “Nuclear fusion” zone is shown in aqua and runs from zero to 0.3. Next is the “Radiative zone” in orange and goes from 0.3 to 0.7. Finally, at right is the “Convection zone” running from 0.7 to 1.0. The upper left panel is a graph illustrating the change of temperature within the Sun. The vertical axis is labeled “Temperature (K)” and labeled from 0 to 15 x 106 in increments of 5 x 10⁶. The plotted line begins at (0, 15 x 106) on the left and slopes down to (1.0, ~0) at right. The panel at lower left is a graph illustrating the change of density within the Sun. The vertical axis is labeled “Density (g/cm3)” and runs from zero to 150 in increments of 50. The plotted line begins at (0, 160) and drops off sharply to near zero at 0.6 of the Sun’s radius. The upper right panel plots the change in luminosity within the Sun. The vertical scale is labeled “Fraction of Luminosity” and goes from zero to 1 in increments of 0.25. The plotted line begins at (0, 0) and rises sharply to 1 at about 0.25 of the Sun’s radius. The line is then constant at 1 throughout the rest of the Solar interior. Finally, the lower right panel plots the change in hydrogen abundance within the Sun. The vertical axis is labeled “Percentage of Hydrogen (by weight)” and goes from zero to 1.0 in increments of 0.25. The plotted line begins at (0, ~0.3) and rises quickly to about 0.75 percent at 0.2 of the Sun’s radius. The line is then constant at 0.75 throughout the rest of the Solar interior.
Diagrams showing how temperature, density, rate of energy generation, and the percentage (by mass) abundance of hydrogen vary inside the Sun. The horizontal scale shows the fraction of the Sun’s radius: the left edge is the very center, and the right edge is the visible surface of the Sun, which is called the photosphere.

Key concepts and summary

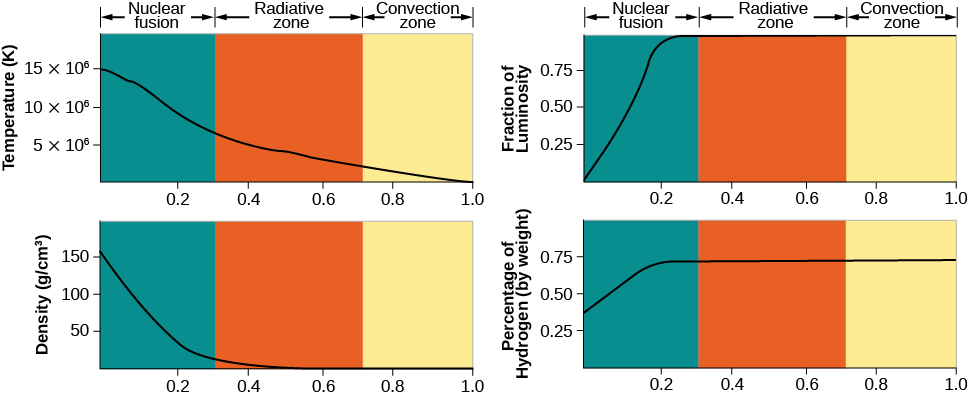
Even though we cannot see inside the Sun, it is possible to calculate what its interior must be like. As input for these calculations, we use what we know about the Sun. It is made entirely of hot gas. Apart from some very tiny changes, the Sun is neither expanding nor contracting (it is in hydrostatic equilibrium) and puts out energy at a constant rate. Fusion of hydrogen occurs in the center of the Sun, and the energy generated is carried to the surface by radiation and then convection. A solar model describes the structure of the Sun’s interior. Specifically, it describes how pressure, temperature, mass, and luminosity depend on the distance from the center of the Sun.

Practice Key Terms 4

Get Jobilize Job Search Mobile App in your pocket Now!

Get it on Google Play Download on the App Store Now


Source:  OpenStax, Astronomy. OpenStax CNX. Apr 12, 2017 Download for free at http://cnx.org/content/col11992/1.13
Google Play and the Google Play logo are trademarks of Google Inc.

Notification Switch

Would you like to follow the 'Astronomy' conversation and receive update notifications?

Ask