

| << Chapter < Page | Chapter >> Page > |
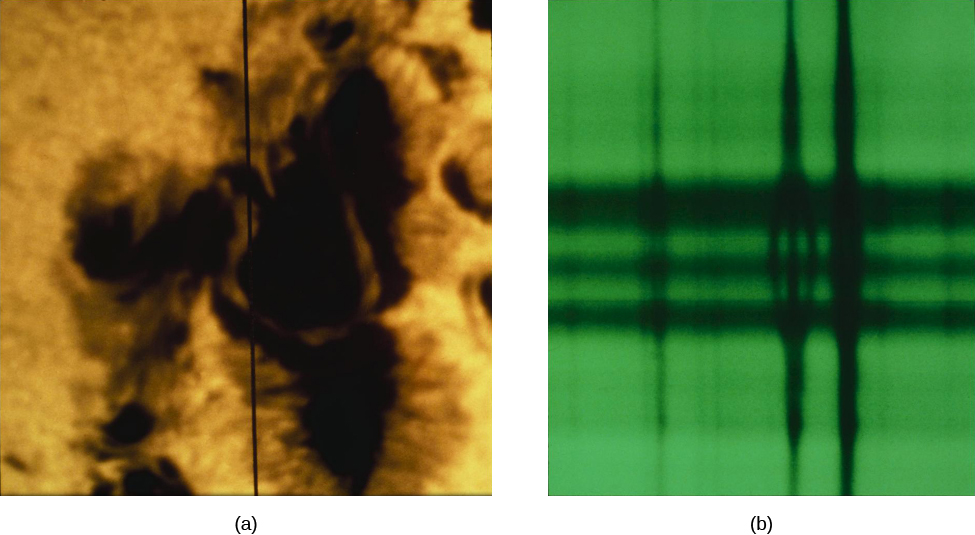
In the presence of a strong magnetic field, however, each energy level is separated into several levels very close to one another. The separation of the levels is proportional to the strength of the field. As a result, spectral lines formed in the presence of a magnetic field are not single lines but a series of very closely spaced lines corresponding to the subdivisions of the atomic energy levels. This splitting of lines in the presence of a magnetic field is what we call the Zeeman effect (after the Dutch scientist who first discovered it in 1896).
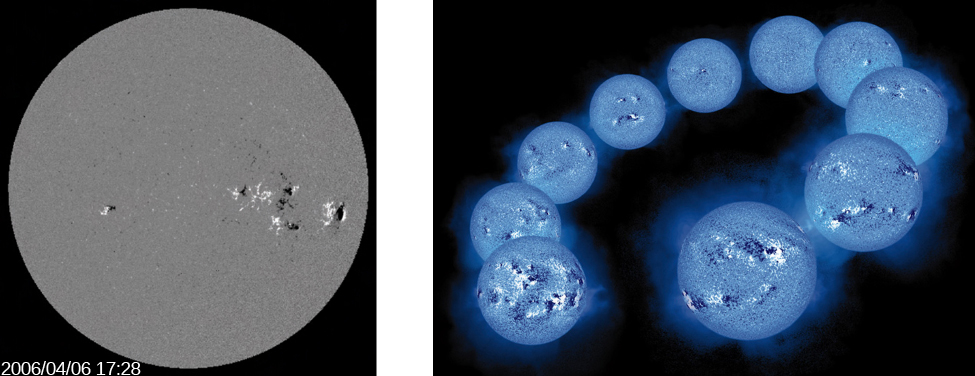
Measurements of the Zeeman effect in the spectra of the light from sunspot regions show them to have strong magnetic fields ( [link] ). Bear in mind that magnets always have a north pole and a south pole. Whenever sunspots are observed in pairs, or in groups containing two principal spots, one of the spots usually has the magnetic polarity of a north-seeking magnetic pole and the other has the opposite polarity. Moreover, during a given cycle, the leading spots of pairs (or leading principle spots of groups) in the Northern Hemisphere all tend to have the same polarity, whereas those in the Southern Hemisphere all tend to have the opposite polarity.
During the next sunspot cycle , however, the polarity of the leading spots is reversed in each hemisphere. For example, if during one cycle, the leading spots in the Northern Hemisphere all had the polarity of a north-seeking pole, then the leading spots in the Southern Hemisphere would have the polarity of a south-seeking pole. During the next cycle, the leading spots in the Northern Hemisphere would have south-seeking polarity, whereas those in the Southern Hemisphere would have north-seeking polarity. Therefore, strictly speaking, the sunspot cycle does not repeat itself in regard to magnetic polarity until two 11-year cycles have passed. A visual representation of the Sun’s magnetic fields, called a magnetogram , can be used to see the relationship between sunspots and the Sun’s magnetic field ( [link] ).
Notification Switch
Would you like to follow the 'Astronomy' conversation and receive update notifications?

|
|

|
|

|
|

|
|

|
|

|
|

|
|

|
|

|
|
|
|