<< Chapter < Page Chapter >> Page >

Learning objectives

By the end of this section, you will be able to:

  • Explain how the thick atmosphere of Titan makes bodies of liquid on its surface possible
  • Describe what we learned from the landing on Titan with the Huygens probe
  • Discuss the features we observed on the surface of Triton when Voyager 2 flew by

We shift our attention now to small worlds in the more distant parts of the solar system. Saturn ’s large moon Titan turns out to be a weird cousin of Earth, with many similarities in spite of frigid temperatures. The Cassini observations of Titan have provided some of the most exciting recent discoveries in planetary science. Neptune’s moon Triton also has unusual characteristics and resembles Pluto, which we will discuss in the following section.

Titan, a moon with atmosphere and hydrocarbon lakes

Titan , first seen in 1655 by the Dutch astronomer Christiaan Huygens, was the first moon discovered after Galileo saw the four large moons of Jupiter. Titan has roughly the same diameter, mass, and density as Callisto or Ganymede. Presumably it also has a similar composition—about half ice and half rock. However, Titan is unique among moons, with a thick atmosphere and lakes and rivers and falling rain (although these are not composed of water but of hydrocarbons such as ethane and methane, which can stay liquid at the frigid temperatures on Titan).

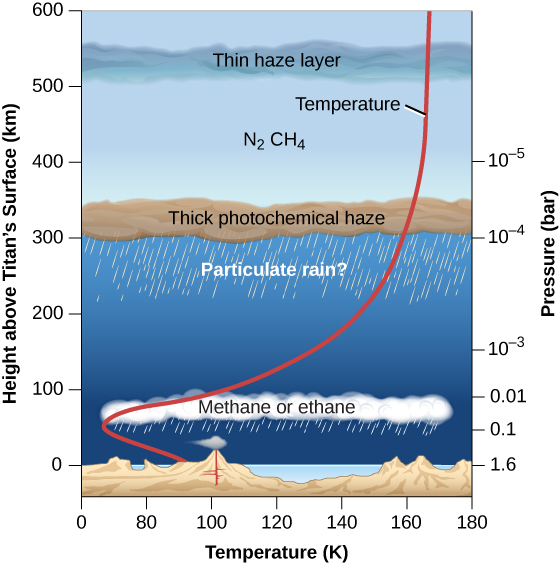
The 1980 Voyager flyby of Titan determined that the surface density of its atmosphere is four times greater than that on Earth. The atmospheric pressure on this moon is 1.6 bars, higher than that on any other moon and, remarkably, even higher than that of the terrestrial planets Mars and Earth. The atmospheric composition is primarily nitrogen, an important way in which Titan’s atmosphere resembles Earth’s.

Also detected in Titan’s atmosphere were carbon monoxide (CO), hydrocarbons (compounds of hydrogen and carbon) such as methane (CH 4 ), ethane (C 2 H 6 ), and propane (C 3 H 8 ), and nitrogen compounds such as hydrogen cyanide (HCN), cyanogen (C 2 N 2 ), and cyanoacetylene (HC 3 N). Their presence indicates an active chemistry in which sunlight interacts with atmospheric nitrogen and methane to create a rich mix of organic molecules. There are also multiple layers of hydrocarbon haze and clouds in the atmosphere, as illustrated in [link] .

Structure of titan’s atmosphere.

A graph of the structure of Titan’s atmosphere. The x-axis is labeled “Temperature (K)” and ranges from 0 at the origin to 180. The y-axis is labeled “Height above Titan’s Surface (km)” and ranges from 0 to 600. The left side of the graph is labeled “Pressure (bar)” and ranges from 1.6 to 10 to the negative 5. A red line labeled “Temperature” starts at approximately 90 K, 0 km, and 1.6 bar, moves leftward to around 20 K, 80 km, and 1 bar, then increases exponentially to the right, ending at approximately 160 K, 600 km, and 10 to the negative 5 bar. The background of the graph shows the different layers of the atmosphere, and is labeled “methane or ethane” at approximately 100 km, “Particulate rain?” at approximately 270 km, “Thick photochemical haze” at approximately 320 km, N_2 CH_4 at approximately 430 km, and “thin haze layer” at approximately 550 km.
Some characteristics of Titan’s atmosphere resemble those of Earth’s atmosphere, although it is much colder than our planet. The red line indicates the temperature of Titan’s atmosphere at different altitudes.

These Voyager discoveries motivated a much more ambitious exploration program using the NASA Cassini Saturn orbiter and a probe to land on Titan called Huygens, built by the European Space Agency. The orbiter, which included several cameras, spectrometers, and a radar imaging system, made dozens of close flybys of Titan between 2004 and 2015, each yielding radar and infrared images of portions of the surface (see Exploring the Outer Planets ). The Huygens probe successfully descended by parachute through the atmosphere, photographing the surface from below the clouds, and landing on January 14, 2005. This was the first (and so far the only) spacecraft landing on a moon in the outer solar system.

Questions & Answers

how do you get the 2/50
Abba Reply
number of sport play by 50 student construct discrete data
Aminu Reply
width of the frangebany leaves on how to write a introduction
Theresa Reply
Solve the mean of variance
Veronica Reply
Step 1: Find the mean. To find the mean, add up all the scores, then divide them by the number of scores. ... Step 2: Find each score's deviation from the mean. ... Step 3: Square each deviation from the mean. ... Step 4: Find the sum of squares. ... Step 5: Divide the sum of squares by n – 1 or N.
kenneth
what is error
Yakuba Reply
Is mistake done to something
Vutshila
Hy
anas
hy
What is the life teble
anas
hy
Jibrin
statistics is the analyzing of data
Tajudeen Reply
what is statics?
Zelalem Reply
how do you calculate mean
Gloria Reply
diveving the sum if all values
Shaynaynay
let A1,A2 and A3 events be independent,show that (A1)^c, (A2)^c and (A3)^c are independent?
Fisaye Reply
what is statistics
Akhisani Reply
data collected all over the world
Shaynaynay
construct a less than and more than table
Imad Reply
The sample of 16 students is taken. The average age in the sample was 22 years with astandard deviation of 6 years. Construct a 95% confidence interval for the age of the population.
Aschalew Reply
Bhartdarshan' is an internet-based travel agency wherein customer can see videos of the cities they plant to visit. The number of hits daily is a normally distributed random variable with a mean of 10,000 and a standard deviation of 2,400 a. what is the probability of getting more than 12,000 hits? b. what is the probability of getting fewer than 9,000 hits?
Akshay Reply
Bhartdarshan'is an internet-based travel agency wherein customer can see videos of the cities they plan to visit. The number of hits daily is a normally distributed random variable with a mean of 10,000 and a standard deviation of 2,400. a. What is the probability of getting more than 12,000 hits
Akshay
1
Bright
Sorry i want to learn more about this question
Bright
Someone help
Bright
a= 0.20233 b=0.3384
Sufiyan
a
Shaynaynay
How do I interpret level of significance?
Mohd Reply
It depends on your business problem or in Machine Learning you could use ROC- AUC cruve to decide the threshold value
Shivam
how skewness and kurtosis are used in statistics
Owen Reply
yes what is it
Taneeya
Got questions? Join the online conversation and get instant answers!
Jobilize.com Reply

Get Jobilize Job Search Mobile App in your pocket Now!

Get it on Google Play Download on the App Store Now


Source:  OpenStax, Astronomy. OpenStax CNX. Apr 12, 2017 Download for free at http://cnx.org/content/col11992/1.13
Google Play and the Google Play logo are trademarks of Google Inc.

Notification Switch

Would you like to follow the 'Astronomy' conversation and receive update notifications?

Ask