<< Chapter < Page Chapter >> Page >

Oxygen dissociation from hemoglobin

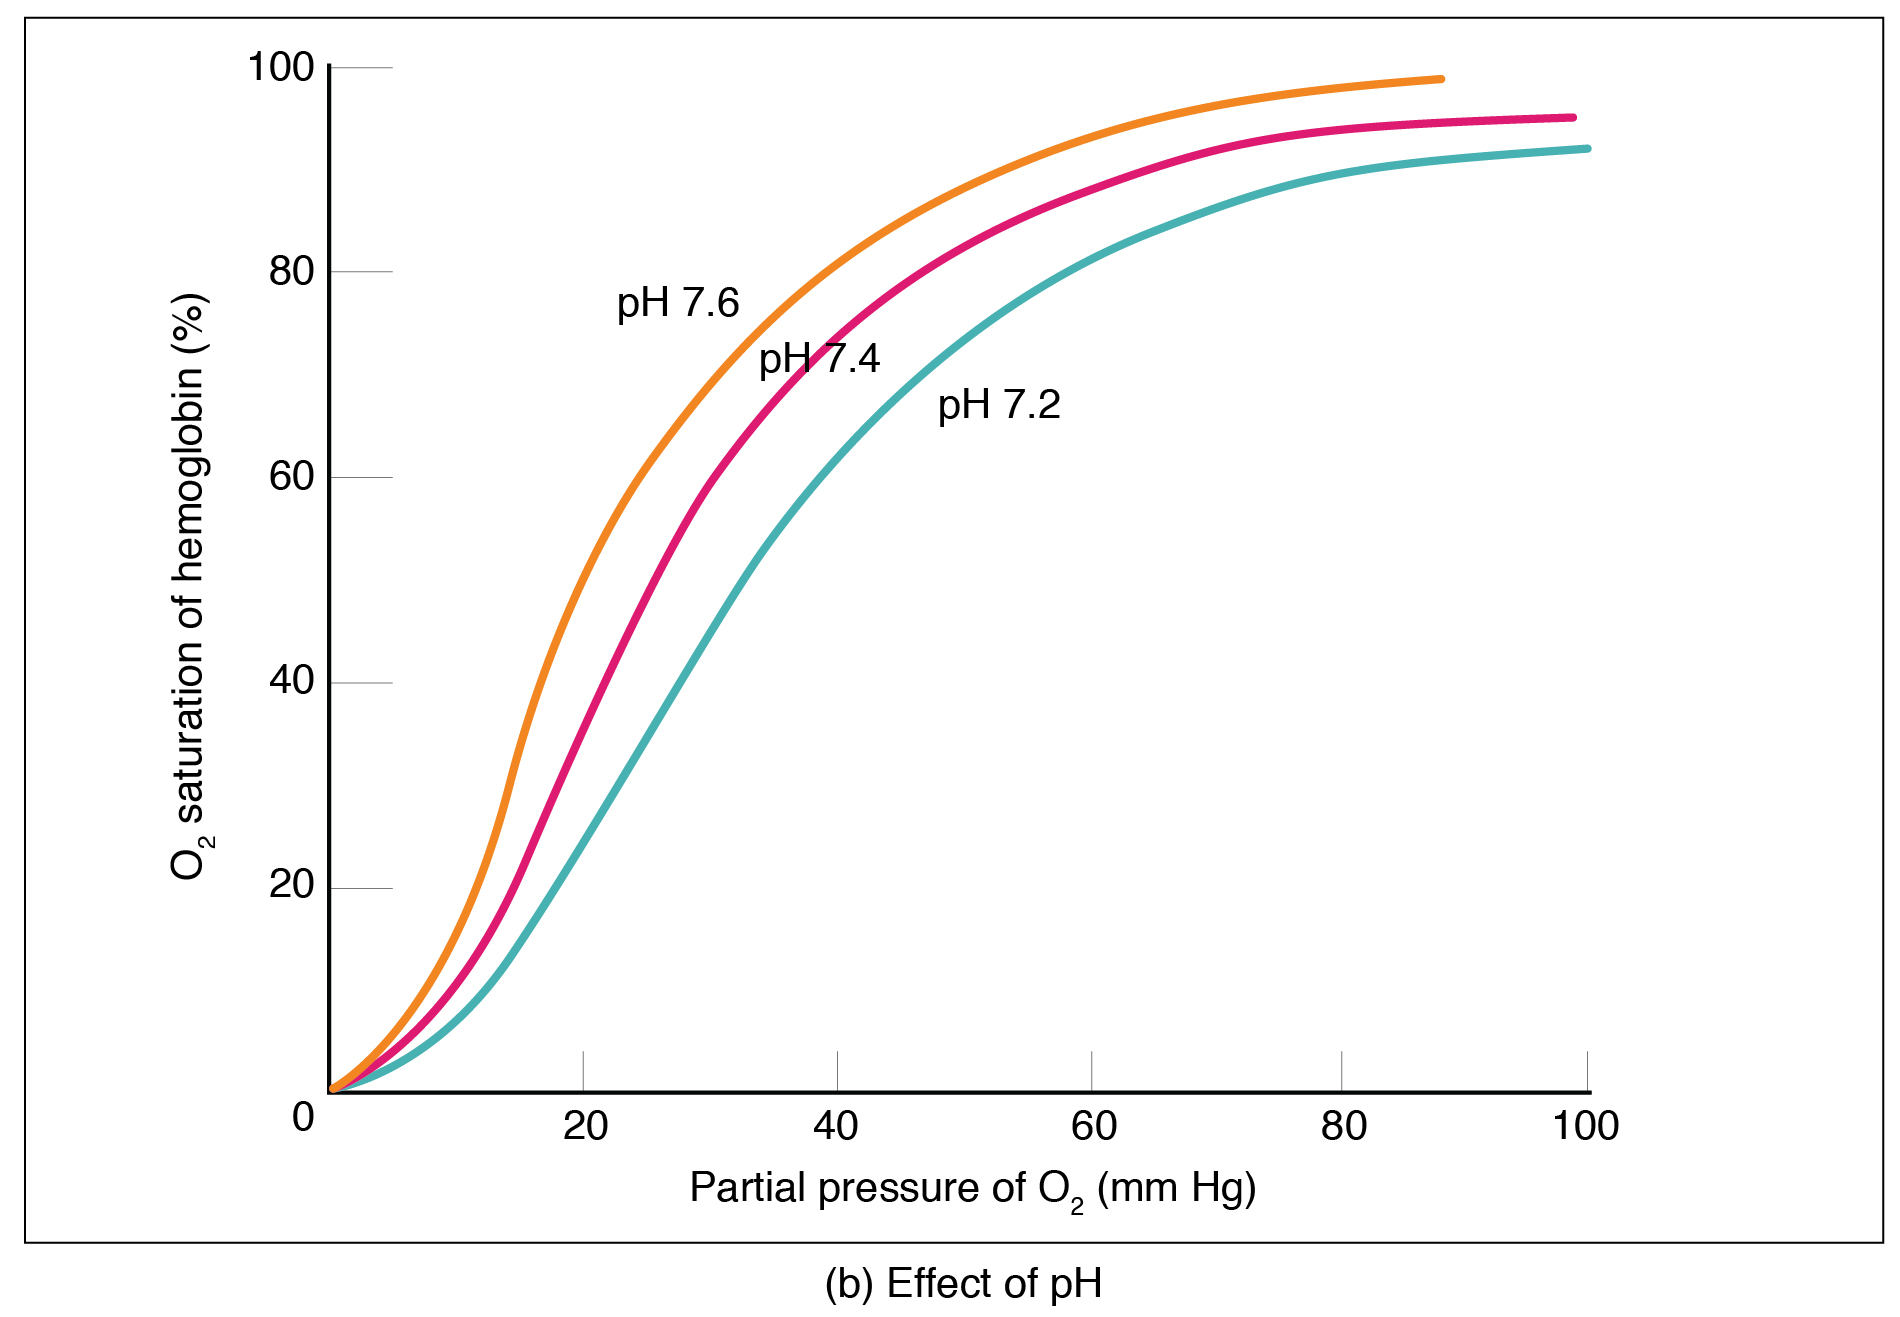
Partial pressure is an important aspect of the binding of oxygen to and disassociation from heme. An oxygen–hemoglobin dissociation curve    is a graph that describes the relationship of partial pressure to the binding of oxygen to heme and its subsequent dissociation from heme ( [link] ). Remember that gases travel from an area of higher partial pressure to an area of lower partial pressure. In addition, the affinity of an oxygen molecule for heme increases as more oxygen molecules are bound. Therefore, in the oxygen–hemoglobin saturation curve, as the partial pressure of oxygen increases, a proportionately greater number of oxygen molecules are bound by heme. Not surprisingly, the oxygen–hemoglobin saturation/dissociation curve also shows that the lower the partial pressure of oxygen, the fewer oxygen molecules are bound to heme. As a result, the partial pressure of oxygen plays a major role in determining the degree of binding of oxygen to heme at the site of the respiratory membrane, as well as the degree of dissociation of oxygen from heme at the site of body tissues.

Oxygen-hemoglobin dissociation and effects of ph and temperature

The top panel of this figure shows a graph with oxygen saturation of the y-axis and partial pressure of oxygen on the x-axis. The middle panel shows oxygen saturation versus partial pressure of oxygen as a function of pH. The bottom panel shows the same relationship as a function of temperature.
These three graphs show (a) the relationship between the partial pressure of oxygen and hemoglobin saturation, (b) the effect of pH on the oxygen–hemoglobin dissociation curve, and (c) the effect of temperature on the oxygen–hemoglobin dissociation curve.

The mechanisms behind the oxygen–hemoglobin saturation/dissociation curve also serve as automatic control mechanisms that regulate how much oxygen is delivered to different tissues throughout the body. This is important because some tissues have a higher metabolic rate than others. Highly active tissues, such as muscle, rapidly use oxygen to produce ATP, lowering the partial pressure of oxygen in the tissue to about 20 mm Hg. The partial pressure of oxygen inside capillaries is about 100 mm Hg, so the difference between the two becomes quite high, about 80 mm Hg. As a result, a greater number of oxygen molecules dissociate from hemoglobin and enter the tissues. The reverse is true of tissues, such as adipose (body fat), which have lower metabolic rates. Because less oxygen is used by these cells, the partial pressure of oxygen within such tissues remains relatively high, resulting in fewer oxygen molecules dissociating from hemoglobin and entering the tissue interstitial fluid. Although venous blood is said to be deoxygenated, some oxygen is still bound to hemoglobin in its red blood cells. This provides an oxygen reserve that can be used when tissues suddenly demand more oxygen.

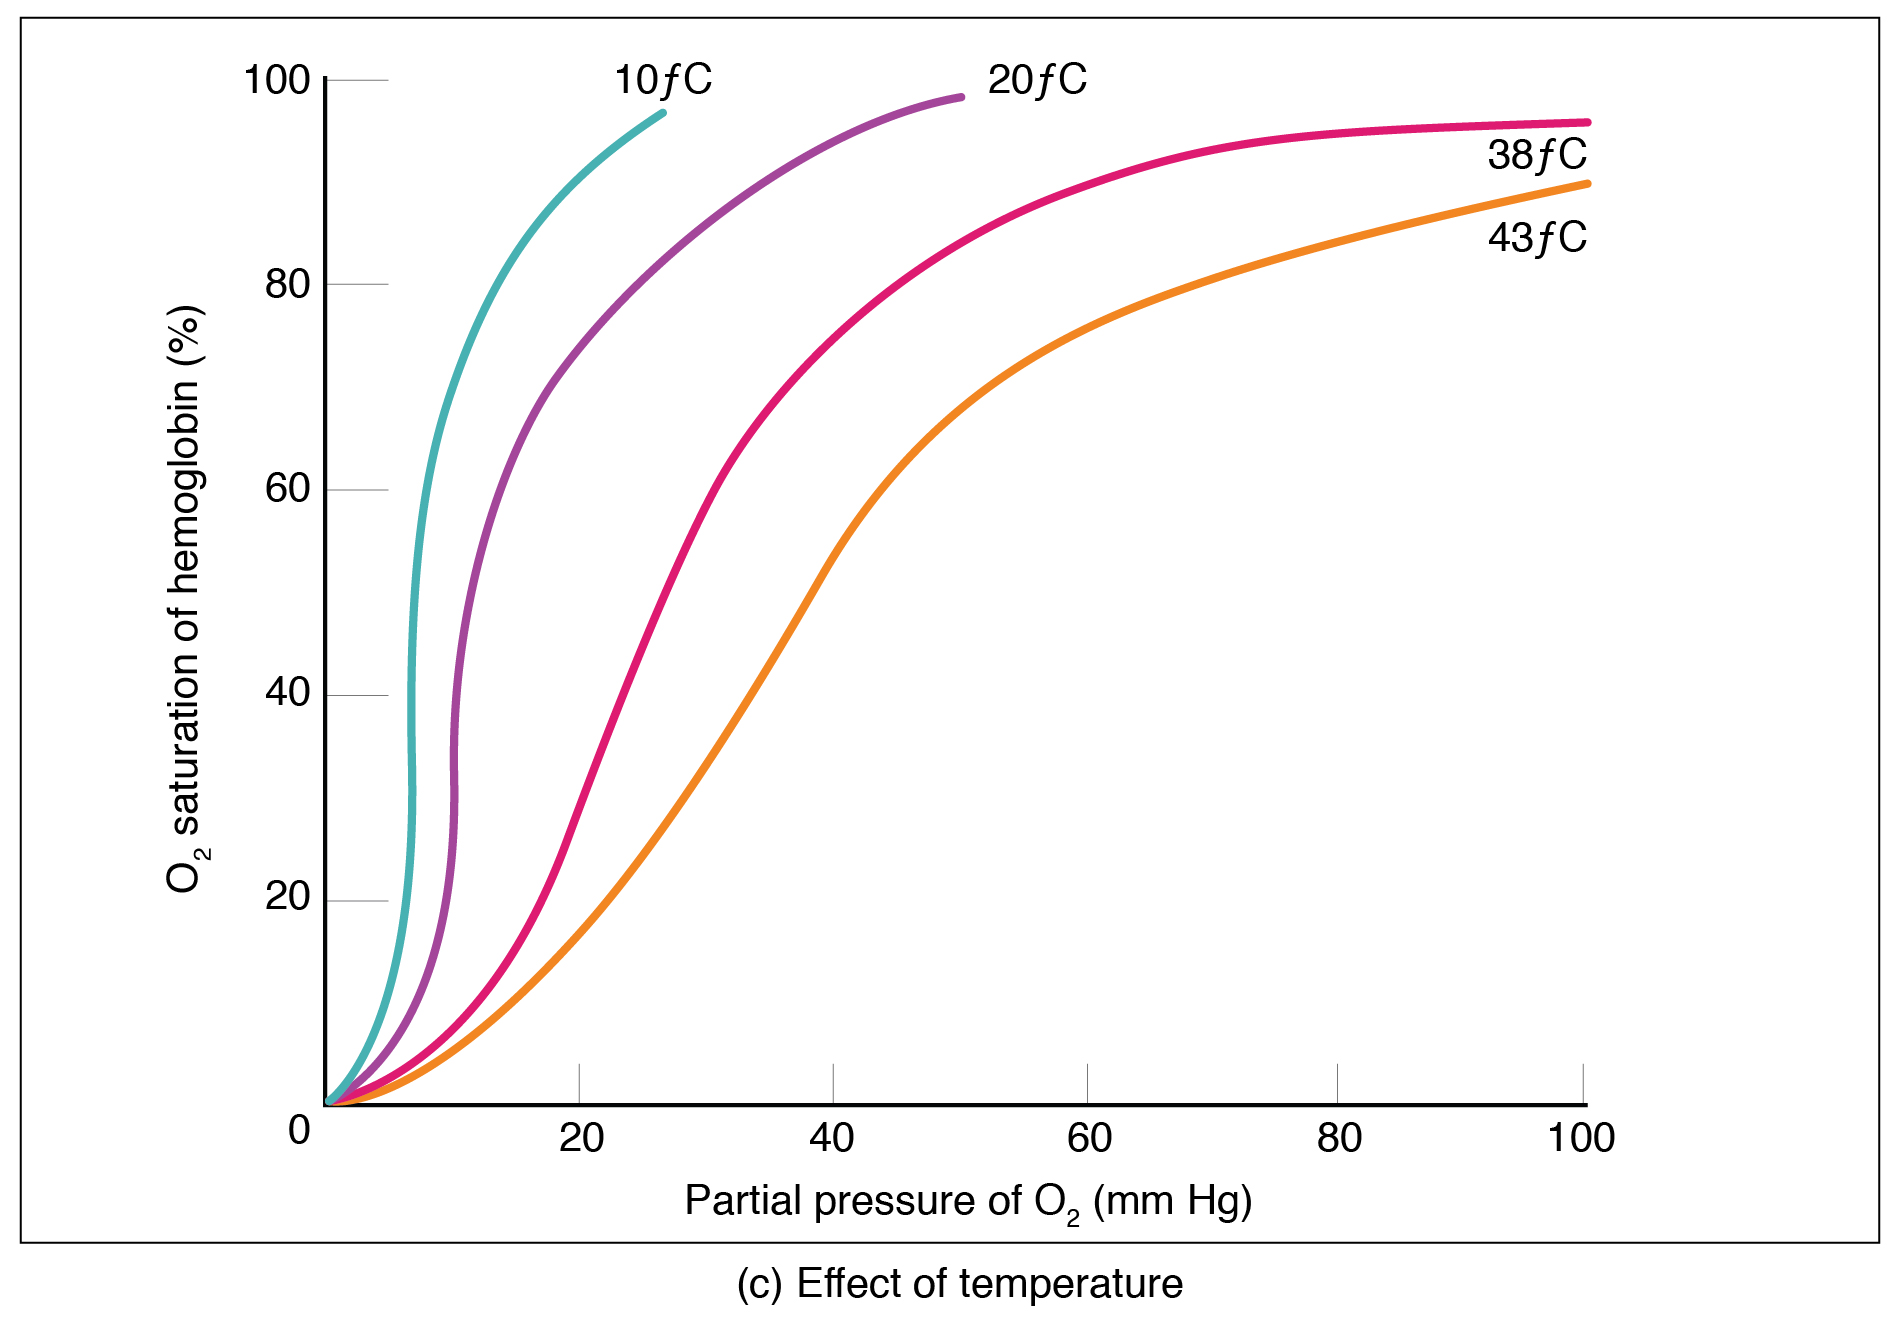
Factors other than partial pressure also affect the oxygen–hemoglobin saturation/dissociation curve. For example, a higher temperature promotes hemoglobin and oxygen to dissociate faster, whereas a lower temperature inhibits dissociation (see [link] , middle ). However, the human body tightly regulates temperature, so this factor may not affect gas exchange throughout the body. The exception to this is in highly active tissues, which may release a larger amount of energy than is given off as heat. As a result, oxygen readily dissociates from hemoglobin, which is a mechanism that helps to provide active tissues with more oxygen.

Questions & Answers

What are the factors that affect demand for a commodity
Florence Reply
differentiate between demand and supply giving examples
Lambiv Reply
differentiated between demand and supply using examples
Lambiv
what is labour ?
Lambiv
how will I do?
Venny Reply
how is the graph works?I don't fully understand
Rezat Reply
information
Eliyee
devaluation
Eliyee
t
WARKISA
hi guys good evening to all
Lambiv
multiple choice question
Aster Reply
appreciation
Eliyee
explain perfect market
Lindiwe Reply
In economics, a perfect market refers to a theoretical construct where all participants have perfect information, goods are homogenous, there are no barriers to entry or exit, and prices are determined solely by supply and demand. It's an idealized model used for analysis,
Ezea
What is ceteris paribus?
Shukri Reply
other things being equal
AI-Robot
When MP₁ becomes negative, TP start to decline. Extuples Suppose that the short-run production function of certain cut-flower firm is given by: Q=4KL-0.6K2 - 0.112 • Where is quantity of cut flower produced, I is labour input and K is fixed capital input (K-5). Determine the average product of lab
Kelo
Extuples Suppose that the short-run production function of certain cut-flower firm is given by: Q=4KL-0.6K2 - 0.112 • Where is quantity of cut flower produced, I is labour input and K is fixed capital input (K-5). Determine the average product of labour (APL) and marginal product of labour (MPL)
Kelo
yes,thank you
Shukri
Can I ask you other question?
Shukri
what is monopoly mean?
Habtamu Reply
What is different between quantity demand and demand?
Shukri Reply
Quantity demanded refers to the specific amount of a good or service that consumers are willing and able to purchase at a give price and within a specific time period. Demand, on the other hand, is a broader concept that encompasses the entire relationship between price and quantity demanded
Ezea
ok
Shukri
how do you save a country economic situation when it's falling apart
Lilia Reply
what is the difference between economic growth and development
Fiker Reply
Economic growth as an increase in the production and consumption of goods and services within an economy.but Economic development as a broader concept that encompasses not only economic growth but also social & human well being.
Shukri
production function means
Jabir
What do you think is more important to focus on when considering inequality ?
Abdisa Reply
any question about economics?
Awais Reply
sir...I just want to ask one question... Define the term contract curve? if you are free please help me to find this answer 🙏
Asui
it is a curve that we get after connecting the pareto optimal combinations of two consumers after their mutually beneficial trade offs
Awais
thank you so much 👍 sir
Asui
In economics, the contract curve refers to the set of points in an Edgeworth box diagram where both parties involved in a trade cannot be made better off without making one of them worse off. It represents the Pareto efficient allocations of goods between two individuals or entities, where neither p
Cornelius
In economics, the contract curve refers to the set of points in an Edgeworth box diagram where both parties involved in a trade cannot be made better off without making one of them worse off. It represents the Pareto efficient allocations of goods between two individuals or entities,
Cornelius
Suppose a consumer consuming two commodities X and Y has The following utility function u=X0.4 Y0.6. If the price of the X and Y are 2 and 3 respectively and income Constraint is birr 50. A,Calculate quantities of x and y which maximize utility. B,Calculate value of Lagrange multiplier. C,Calculate quantities of X and Y consumed with a given price. D,alculate optimum level of output .
Feyisa Reply
Answer
Feyisa
c
Jabir
the market for lemon has 10 potential consumers, each having an individual demand curve p=101-10Qi, where p is price in dollar's per cup and Qi is the number of cups demanded per week by the i th consumer.Find the market demand curve using algebra. Draw an individual demand curve and the market dema
Gsbwnw Reply
suppose the production function is given by ( L, K)=L¼K¾.assuming capital is fixed find APL and MPL. consider the following short run production function:Q=6L²-0.4L³ a) find the value of L that maximizes output b)find the value of L that maximizes marginal product
Abdureman
Got questions? Join the online conversation and get instant answers!
Jobilize.com Reply

Get Jobilize Job Search Mobile App in your pocket Now!

Get it on Google Play Download on the App Store Now


Source:  OpenStax, Anatomy & Physiology. OpenStax CNX. Feb 04, 2016 Download for free at http://legacy.cnx.org/content/col11496/1.8
Google Play and the Google Play logo are trademarks of Google Inc.

Notification Switch

Would you like to follow the 'Anatomy & Physiology' conversation and receive update notifications?

Ask