

| << Chapter < Page | Chapter >> Page > |
An easy way to see how much of the brain a person uses is to take measurements of brain activity while performing a task. An example of this kind of measurement is functional magnetic resonance imaging (fMRI), which generates a map of the most active areas and can be generated and presented in three dimensions ( [link] ). This procedure is different from the standard MRI technique because it is measuring changes in the tissue in time with an experimental condition or event.
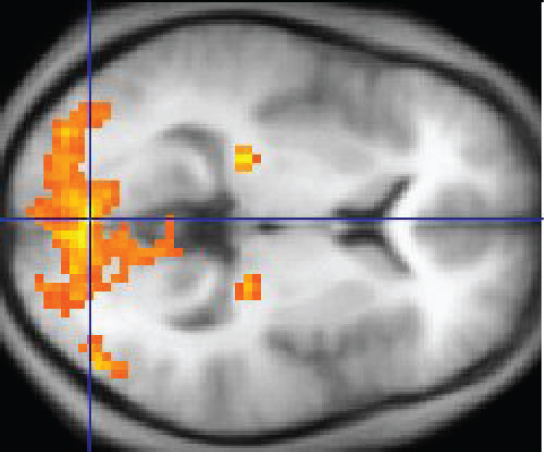
The underlying assumption is that active nervous tissue will have greater blood flow. By having the subject perform a visual task, activity all over the brain can be measured. Consider this possible experiment: the subject is told to look at a screen with a black dot in the middle (a fixation point). A photograph of a face is projected on the screen away from the center. The subject has to look at the photograph and decipher what it is. The subject has been instructed to push a button if the photograph is of someone they recognize. The photograph might be of a celebrity, so the subject would press the button, or it might be of a random person unknown to the subject, so the subject would not press the button.
In this task, visual sensory areas would be active, integrating areas would be active, motor areas responsible for moving the eyes would be active, and motor areas for pressing the button with a finger would be active. Those areas are distributed all around the brain and the fMRI images would show activity in more than just 10 percent of the brain (some evidence suggests that about 80 percent of the brain is using energy—based on blood flow to the tissue—during well-defined tasks similar to the one suggested above). This task does not even include all of the functions the brain performs. There is no language response, the body is mostly lying still in the MRI machine, and it does not consider the autonomic functions that would be ongoing in the background.
The nervous system can be separated into divisions on the basis of anatomy and physiology. The anatomical divisions are the central and peripheral nervous systems. The CNS is the brain and spinal cord. The PNS is everything else. Functionally, the nervous system can be divided into those regions that are responsible for sensation, those that are responsible for integration, and those that are responsible for generating responses. All of these functional areas are found in both the central and peripheral anatomy.
Notification Switch
Would you like to follow the 'Anatomy & Physiology' conversation and receive update notifications?

|
|
|
|
|

|
|

|
|

|
|

|
|

|
|

|
|

|
|

|
|

|
|

|