<< Chapter < Page Chapter >> Page >
By the end of this section, you will be able to:
  • Explain how water levels in the body influence the thirst cycle
  • Identify the main route by which water leaves the body
  • Describe the role of ADH and its effect on body water levels
  • Define dehydration and identify common causes of dehydration

On a typical day, the average adult will take in about 2500 mL (almost 3 quarts) of aqueous fluids. Although most of the intake comes through the digestive tract, about 230 mL (8 ounces) per day is generated metabolically, in the last steps of aerobic respiration. Additionally, each day about the same volume (2500 mL) of water leaves the body by different routes; most of this lost water is removed as urine. The kidneys also can adjust blood volume though mechanisms that draw water out of the filtrate and urine. The kidneys can regulate water levels in the body; they conserve water if you are dehydrated, and they can make urine more dilute to expel excess water if necessary. Water is lost through the skin through evaporation from the skin surface without overt sweating and from air expelled from the lungs. This type of water loss is called insensible water loss because a person is usually unaware of it.

Regulation of water intake

Osmolality is the ratio of solutes in a solution to a volume of solvent in a solution. Plasma osmolality is thus the ratio of solutes to water in blood plasma. A person’s plasma osmolality value reflects his or her state of hydration. A healthy body maintains plasma osmolality within a narrow range, by employing several mechanisms that regulate both water intake and output.

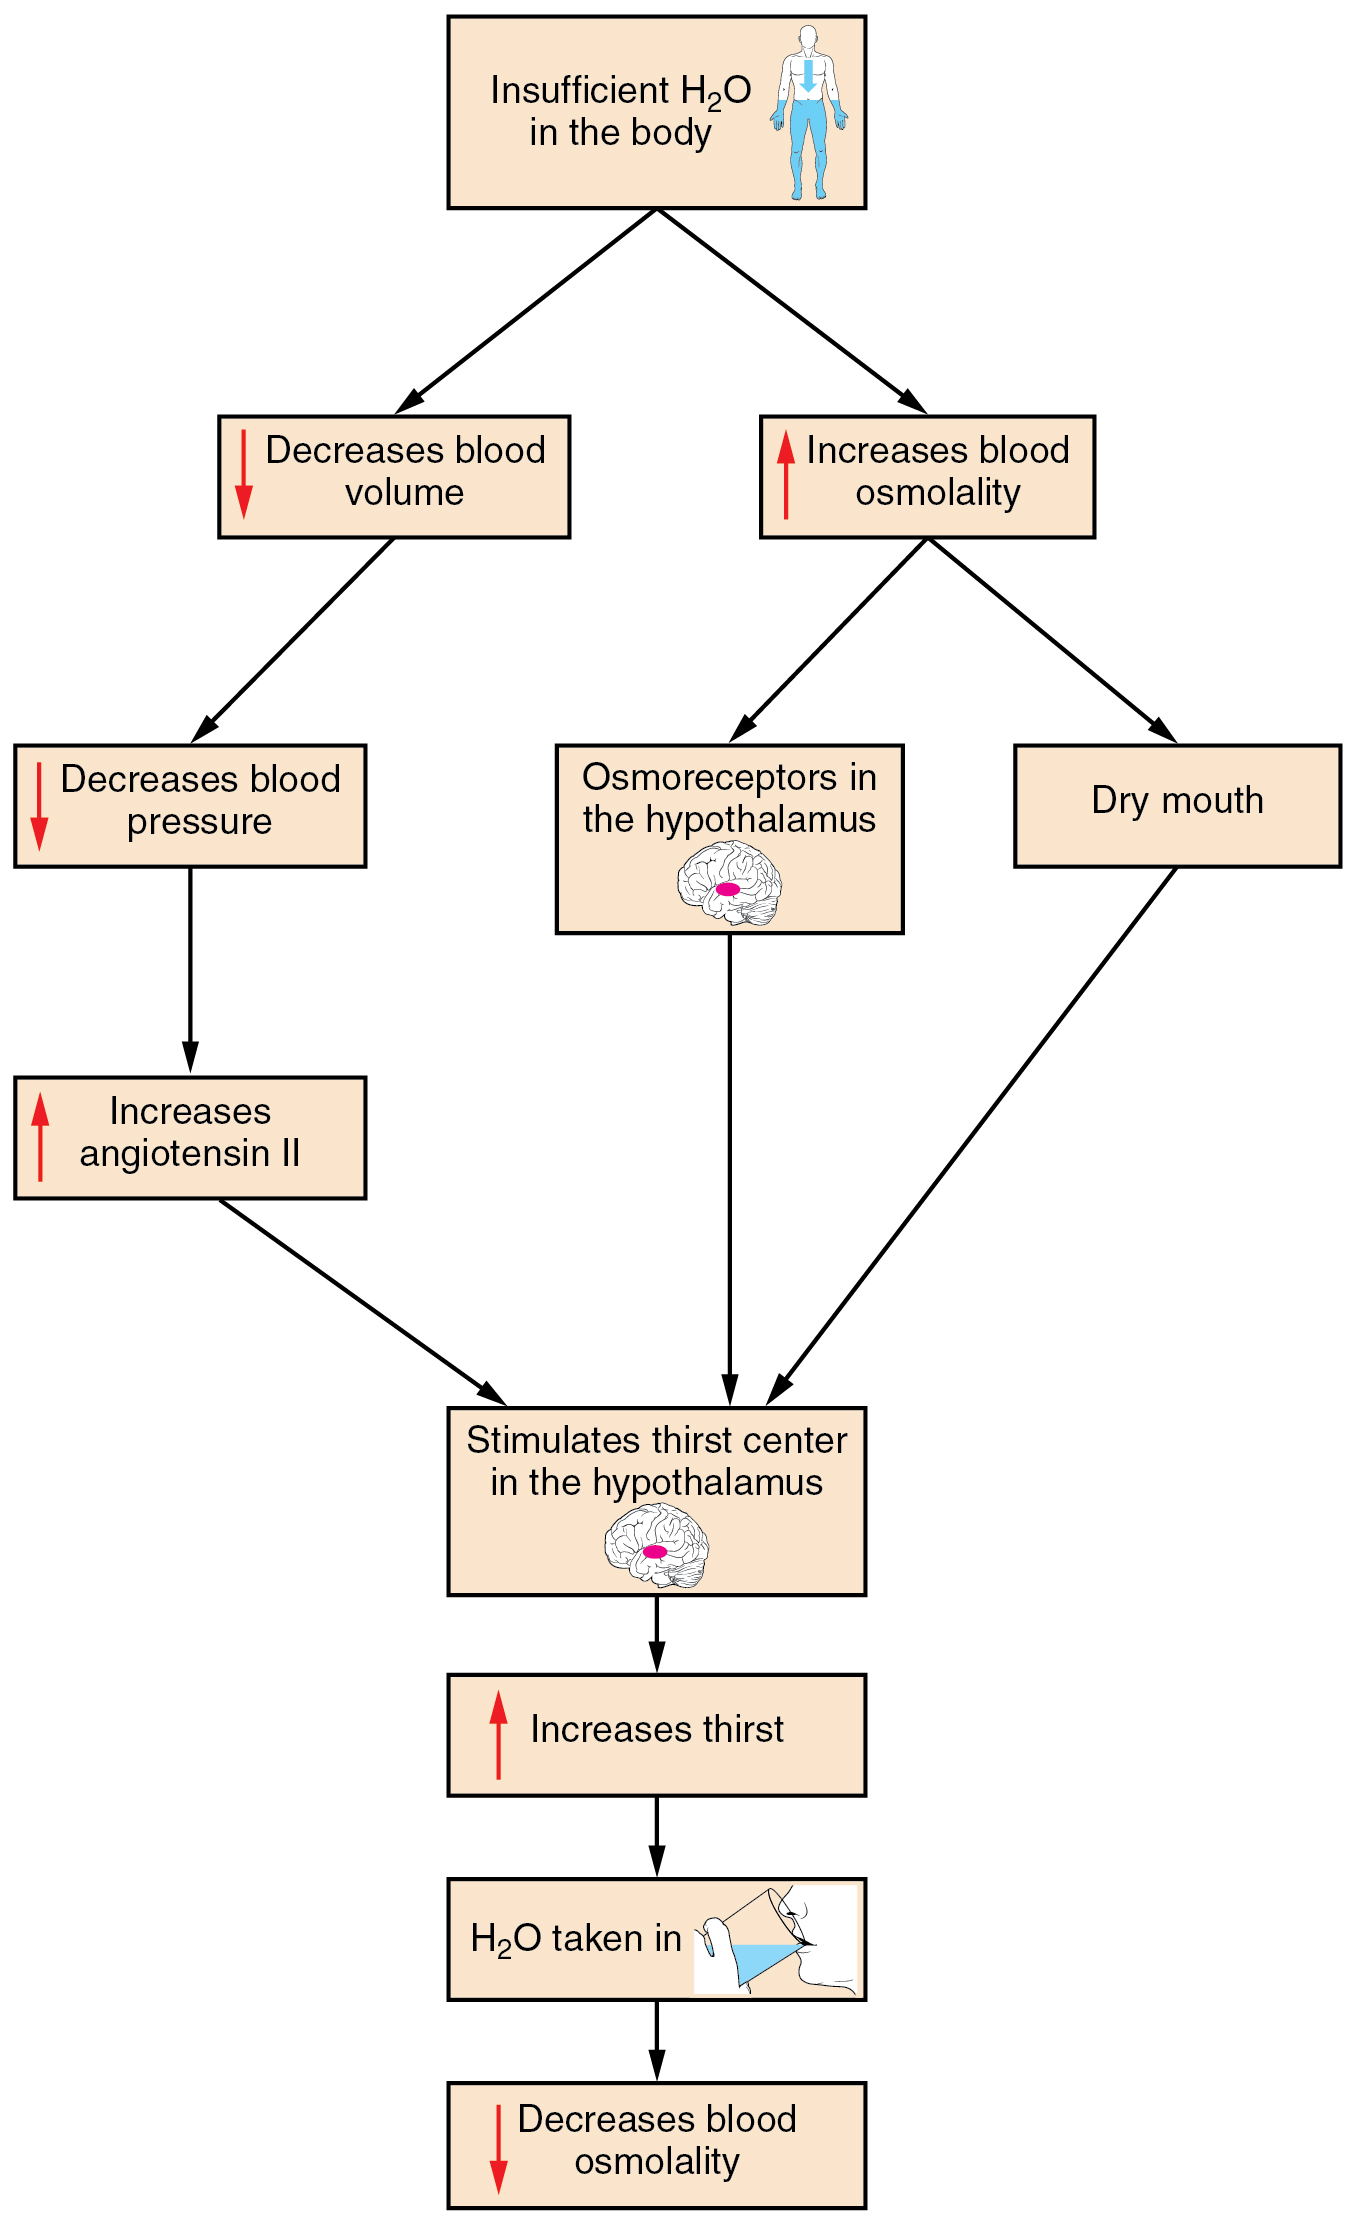
Drinking water is considered voluntary. So how is water intake regulated by the body? Consider someone who is experiencing dehydration    , a net loss of water that results in insufficient water in blood and other tissues. The water that leaves the body, as exhaled air, sweat, or urine, is ultimately extracted from blood plasma. As the blood becomes more concentrated, the thirst response—a sequence of physiological processes—is triggered ( [link] ). Osmoreceptors are sensory receptors in the thirst center in the hypothalamus that monitor the concentration of solutes (osmolality) of the blood. If blood osmolality increases above its ideal value, the hypothalamus transmits signals that result in a conscious awareness of thirst. The person should (and normally does) respond by drinking water. The hypothalamus of a dehydrated person also releases antidiuretic hormone (ADH) through the posterior pituitary gland. ADH signals the kidneys to recover water from urine, effectively diluting the blood plasma. To conserve water, the hypothalamus of a dehydrated person also sends signals via the sympathetic nervous system to the salivary glands in the mouth. The signals result in a decrease in watery, serous output (and an increase in stickier, thicker mucus output). These changes in secretions result in a “dry mouth” and the sensation of thirst.

A flowchart showing the thirst response

This figure is a top-to bottom flowchart describing the thirst response. The topmost box of the chart states that there is insufficient water in the body, which has two effects. The left branch of the chart leads to decreased blood volume, which leads to decreased blood pressure. This triggers an increase in angiotensin two. Angiotensin two stimulates the thirst center in the hypothalamus. On the right branch, insufficient water in the body leads to increased blood osmolality, which causes dry mouth. Increased blood osmolality and dry mouth is sensed by osmoreceptors in the hypothalamus. This stimulates the thirst center in the hypothalamus to increase thirst, giving a person the urge to drink. Drinking decreases blood osmolality back to homeostatic levels.
The thirst response begins when osmoreceptors detect a decrease in water levels in the blood.

Questions & Answers

how do you get the 2/50
Abba Reply
number of sport play by 50 student construct discrete data
Aminu Reply
width of the frangebany leaves on how to write a introduction
Theresa Reply
Solve the mean of variance
Veronica Reply
Step 1: Find the mean. To find the mean, add up all the scores, then divide them by the number of scores. ... Step 2: Find each score's deviation from the mean. ... Step 3: Square each deviation from the mean. ... Step 4: Find the sum of squares. ... Step 5: Divide the sum of squares by n – 1 or N.
kenneth
what is error
Yakuba Reply
Is mistake done to something
Vutshila
Hy
anas
hy
What is the life teble
anas
hy
Jibrin
statistics is the analyzing of data
Tajudeen Reply
what is statics?
Zelalem Reply
how do you calculate mean
Gloria Reply
diveving the sum if all values
Shaynaynay
let A1,A2 and A3 events be independent,show that (A1)^c, (A2)^c and (A3)^c are independent?
Fisaye Reply
what is statistics
Akhisani Reply
data collected all over the world
Shaynaynay
construct a less than and more than table
Imad Reply
The sample of 16 students is taken. The average age in the sample was 22 years with astandard deviation of 6 years. Construct a 95% confidence interval for the age of the population.
Aschalew Reply
Bhartdarshan' is an internet-based travel agency wherein customer can see videos of the cities they plant to visit. The number of hits daily is a normally distributed random variable with a mean of 10,000 and a standard deviation of 2,400 a. what is the probability of getting more than 12,000 hits? b. what is the probability of getting fewer than 9,000 hits?
Akshay Reply
Bhartdarshan'is an internet-based travel agency wherein customer can see videos of the cities they plan to visit. The number of hits daily is a normally distributed random variable with a mean of 10,000 and a standard deviation of 2,400. a. What is the probability of getting more than 12,000 hits
Akshay
1
Bright
Sorry i want to learn more about this question
Bright
Someone help
Bright
a= 0.20233 b=0.3384
Sufiyan
a
Shaynaynay
How do I interpret level of significance?
Mohd Reply
It depends on your business problem or in Machine Learning you could use ROC- AUC cruve to decide the threshold value
Shivam
how skewness and kurtosis are used in statistics
Owen Reply
yes what is it
Taneeya
Got questions? Join the online conversation and get instant answers!
Jobilize.com Reply

Get Jobilize Job Search Mobile App in your pocket Now!

Get it on Google Play Download on the App Store Now


Source:  OpenStax, Anatomy & Physiology. OpenStax CNX. Feb 04, 2016 Download for free at http://legacy.cnx.org/content/col11496/1.8
Google Play and the Google Play logo are trademarks of Google Inc.

Notification Switch

Would you like to follow the 'Anatomy & Physiology' conversation and receive update notifications?

Ask