| << Chapter < Page | Chapter >> Page > |
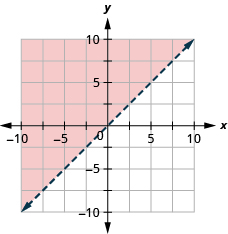
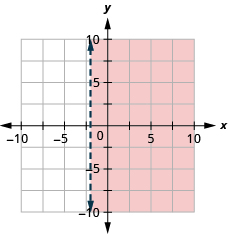
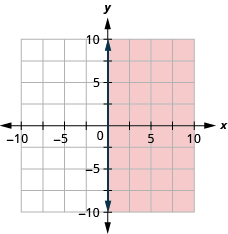
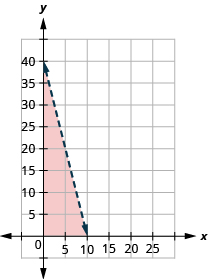
Graph the linear inequality .
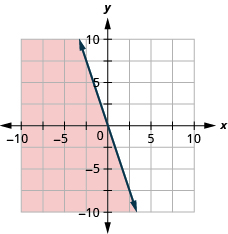
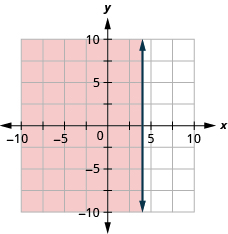
Graph the linear inequality .
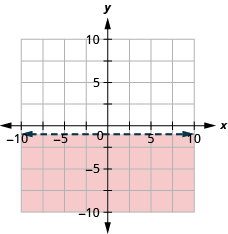
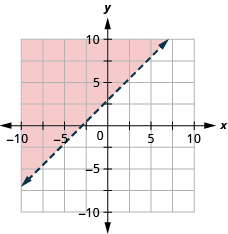
Graph the linear inequality .
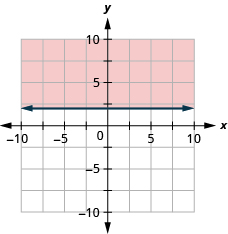
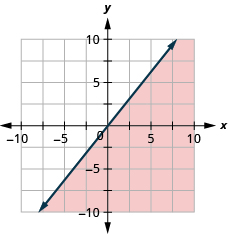
Graph the linear inequality .
Graph the linear inequality .
Graph the linear inequality .
Graph the linear inequality .
Graph the linear inequality .
Graph the linear inequality .
Graph the linear inequality .
Money. Gerry wants to have a maximum of $100 cash at the ticket booth when his church carnival opens. He will have $1 bills and $5 bills. If x is the number of $1 bills and y is the number of $5 bills, the inequality models the situation.
Shopping. Tula has $20 to spend at the used book sale. Hardcover books cost $2 each and paperback books cost $0.50 each. If x is the number of hardcover books Tula can buy and y is the number of paperback books she can buy, the inequality models the situation.
Lester thinks that the solution of any inequality with a>sign is the region above the line and the solution of any inequality with a<sign is the region below the line. Is Lester correct? Explain why or why not.
Explain why in some graphs of linear inequalities the boundary line is solid but in other graphs it is dashed.
ⓐ After completing the exercises, use this checklist to evaluate your mastery of the objectives of this section.
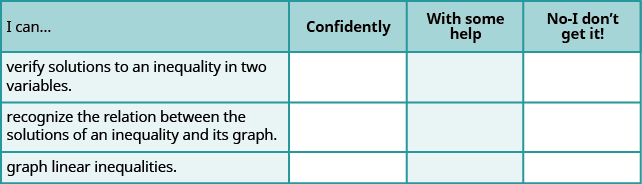
ⓑ What does this checklist tell you about your mastery of this section? What steps will you take to improve?
Plot Points in a Rectangular Coordinate System
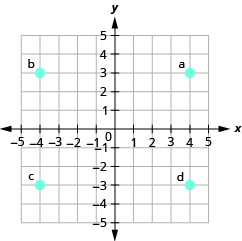
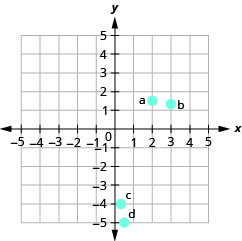
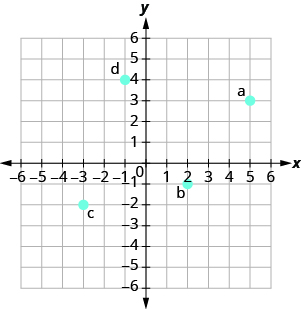
In the following exercises, plot each point in a rectangular coordinate system.
Identify Points on a Graph
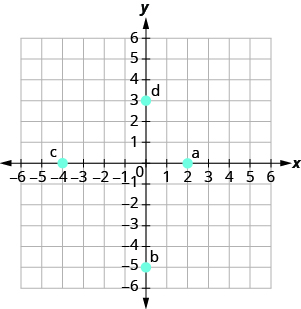
In the following exercises, name the ordered pair of each point shown in the rectangular coordinate system.
Verify Solutions to an Equation in Two Variables
In the following exercises, which ordered pairs are solutions to the given equations?
Complete a Table of Solutions to a Linear Equation in Two Variables
In the following exercises, complete the table to find solutions to each linear equation.
Find Solutions to a Linear Equation in Two Variables
In the following exercises, find three solutions to each linear equation.
Notification Switch
Would you like to follow the 'Elementary algebra' conversation and receive update notifications?

|
|

|
|

|
|

|
|

|
|

|
|

|
|
|
|
|

|
|

|