<< Chapter < Page Chapter >> Page >

The floor of your room is horizontal. Its slope is 0. If you carefully placed a ball on the floor, it would not roll away.

Now, we’ll consider a vertical line, the line.

The graph shows the x y coordinate plane. The x-axis runs from negative 1 to 5 and the y-axis runs from negative 2 to 2. A line passes through the points (3, 0) and (3, 2).

What is the rise? The rise is 2. What is the run? The run is 0. What is the slope? m = rise run m = 2 0

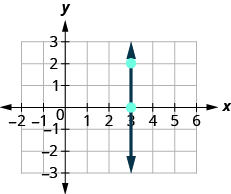
But we can’t divide by 0. Division by 0 is not defined. So we say that the slope of the vertical line x = 3 is undefined.

The slope of any vertical line is undefined. When the x -coordinates of a line are all the same, the run is 0.

Slope of a vertical line

The slope of a vertical line, x = a , is undefined.

Find the slope of each line:

x = 8 y = −5 .

Solution

x = 8
This is a vertical line.
Its slope is undefined.

y = −5
This is a horizontal line.
It has slope 0.

Got questions? Get instant answers now!

Find the slope of the line: x = −4 .

undefined

Got questions? Get instant answers now!

Find the slope of the line: y = 7 .

0

Got questions? Get instant answers now!

Quick guide to the slopes of lines

This figure shows four lines with arrows. The first line rises up and runs to the right. It has a positive slope. The second line falls down and runs to the right. It has a negative slope. The third line is neither rises nor falls, extending horizontally in either direction. It has a slope of zero. The fourth line is completely vertical, one end rising up and the other rising down, running neither to the left nor right. It has an undefined slope.

Remember, we ‘read’ a line from left to right, just like we read written words in English.

Use the slope formula to find the slope of a line between two points

Doing the Manipulative Mathematics activity “Slope of Lines Between Two Points” will help you develop a better understanding of how to find the slope of a line between two points.

Sometimes we’ll need to find the slope of a line between two points when we don’t have a graph to count out the rise and the run. We could plot the points on grid paper, then count out the rise and the run, but as we’ll see, there is a way to find the slope without graphing. Before we get to it, we need to introduce some algebraic notation.

We have seen that an ordered pair ( x , y ) gives the coordinates of a point. But when we work with slopes, we use two points. How can the same symbol ( x , y ) be used to represent two different points? Mathematicians use subscripts to distinguish the points.

( x 1 , y 1 ) read ‘ x sub 1, y sub 1’ ( x 2 , y 2 ) read ‘ x sub 2, y sub 2’

The use of subscripts in math is very much like the use of last name initials in elementary school. Maybe you remember Laura C. and Laura M. in your third grade class?

We will use ( x 1 , y 1 ) to identify the first point and ( x 2 , y 2 ) to identify the second point.

If we had more than two points, we could use ( x 3 , y 3 ) , ( x 4 , y 4 ) , and so on.

Let’s see how the rise and run relate to the coordinates of the two points by taking another look at the slope of the line between the points ( 2 , 3 ) and ( 7 , 6 ) .

The graph shows the x y coordinate plane. The x and y-axes run from 0 to 7. A line passes through the points (2, 3) and (7, 6), which are plotted and labeled. The ordered pair (2, 3) is labeled (x subscript 1, y subscript 1). The ordered pair (7, 6) is labeled (x subscript 2, y subscript 2). An additional point is plotted at (2, 6). The three points form a right triangle, with the line from (2, 3) to (7, 6) forming the hypotenuse and the lines from (2, 3) to (2, 6) and from (2, 6) to (7, 6) forming the legs. The first leg, from (2, 3) to (2, 6) is labeled y subscript 2 minus y subscript 1, 6 minus 3, and 3. The second leg, from (2, 3) to (7, 6), is labeled x subscript 2 minus x subscript 1, y minus 2, and 5.

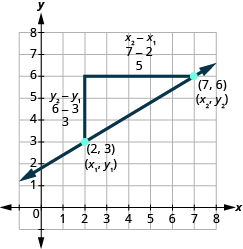
Since we have two points, we will use subscript notation, ( 2 , x 1 , 3 y 1 ) ( 7 , 6 x 2 , y 2 ) .

On the graph, we counted the rise of 3 and the run of 5.

Notice that the rise of 3 can be found by subtracting the y -coordinates 6 and 3.

3 = 6 3

And the run of 5 can be found by subtracting the x -coordinates 7 and 2.

5 = 7 2

We know m = rise run . So m = 3 5 .

We rewrite the rise and run by putting in the coordinates m = 6 3 7 2 .

But 6 is y 2 , the y -coordinate of the second point and 3 is y 1 , the y -coordinate of the first point.

So we can rewrite the slope using subscript notation. m = y 2 y 1 7 2

Also, 7 is x 2 , the x -coordinate of the second point and 2 is x 1 , the x -coordinate of the first point.

So, again, we rewrite the slope using subscript notation. m = y 2 y 1 x 2 x 1

We’ve shown that m = y 2 y 1 x 2 x 1 is really another version of m = rise run . We can use this formula to find the slope of a line when we have two points on the line.

Questions & Answers

how do you get the 2/50
Abba Reply
number of sport play by 50 student construct discrete data
Aminu Reply
width of the frangebany leaves on how to write a introduction
Theresa Reply
Solve the mean of variance
Veronica Reply
Step 1: Find the mean. To find the mean, add up all the scores, then divide them by the number of scores. ... Step 2: Find each score's deviation from the mean. ... Step 3: Square each deviation from the mean. ... Step 4: Find the sum of squares. ... Step 5: Divide the sum of squares by n – 1 or N.
kenneth
what is error
Yakuba Reply
Is mistake done to something
Vutshila
Hy
anas
hy
What is the life teble
anas
hy
Jibrin
statistics is the analyzing of data
Tajudeen Reply
what is statics?
Zelalem Reply
how do you calculate mean
Gloria Reply
diveving the sum if all values
Shaynaynay
let A1,A2 and A3 events be independent,show that (A1)^c, (A2)^c and (A3)^c are independent?
Fisaye Reply
what is statistics
Akhisani Reply
data collected all over the world
Shaynaynay
construct a less than and more than table
Imad Reply
The sample of 16 students is taken. The average age in the sample was 22 years with astandard deviation of 6 years. Construct a 95% confidence interval for the age of the population.
Aschalew Reply
Bhartdarshan' is an internet-based travel agency wherein customer can see videos of the cities they plant to visit. The number of hits daily is a normally distributed random variable with a mean of 10,000 and a standard deviation of 2,400 a. what is the probability of getting more than 12,000 hits? b. what is the probability of getting fewer than 9,000 hits?
Akshay Reply
Bhartdarshan'is an internet-based travel agency wherein customer can see videos of the cities they plan to visit. The number of hits daily is a normally distributed random variable with a mean of 10,000 and a standard deviation of 2,400. a. What is the probability of getting more than 12,000 hits
Akshay
1
Bright
Sorry i want to learn more about this question
Bright
Someone help
Bright
a= 0.20233 b=0.3384
Sufiyan
a
Shaynaynay
How do I interpret level of significance?
Mohd Reply
It depends on your business problem or in Machine Learning you could use ROC- AUC cruve to decide the threshold value
Shivam
how skewness and kurtosis are used in statistics
Owen Reply
yes what is it
Taneeya
Got questions? Join the online conversation and get instant answers!
Jobilize.com Reply
Practice Key Terms 7

Get Jobilize Job Search Mobile App in your pocket Now!

Get it on Google Play Download on the App Store Now


Source:  OpenStax, Elementary algebra. OpenStax CNX. Jan 18, 2017 Download for free at http://cnx.org/content/col12116/1.2
Google Play and the Google Play logo are trademarks of Google Inc.

Notification Switch

Would you like to follow the 'Elementary algebra' conversation and receive update notifications?

Ask