| << Chapter < Page | Chapter >> Page > |
Graph and Interpret Applications of Slope–Intercept
Katherine is a private chef. The equation models the relation between her weekly cost, C , in dollars and the number of meals, m , that she serves.
Marjorie teaches piano. The equation models the relation between her weekly profit, P , in dollars and the number of student lessons, s , that she teaches.
ⓐ −$250
ⓑ $450
ⓒ The slope, 35, means that Marjorie’s weekly profit,
P , increases by $35 for each additional student lesson she teaches. The
P –intercept means that when the number of lessons is 0, Marjorie loses $250.
ⓓ
Use Slopes to Identify Parallel Lines
In the following exercises, use slopes and y-intercepts to determine if the lines are parallel.
Use Slopes to Identify Perpendicular Lines
In the following exercises, use slopes and y-intercepts to determine if the lines are perpendicular.
Find an Equation of the Line Given the Slope and y -Intercept
In the following exercises, find the equation of a line with given slope and y-intercept. Write the equation in slope–intercept form.
slope and
slope and
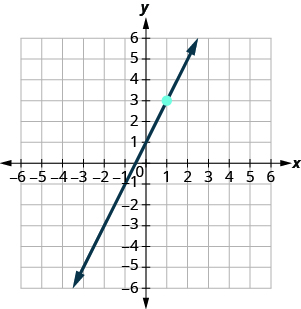
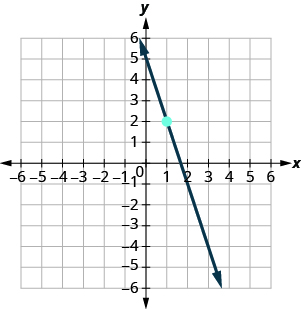
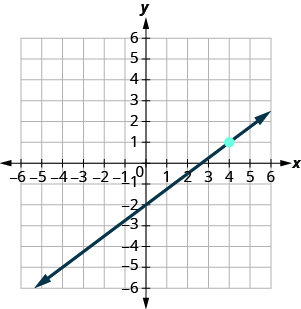
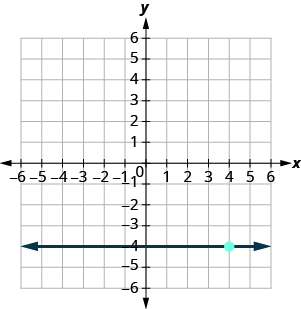
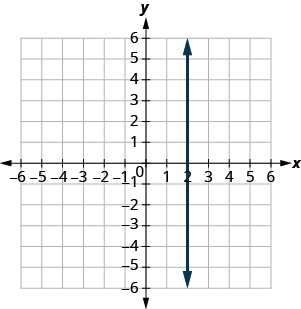
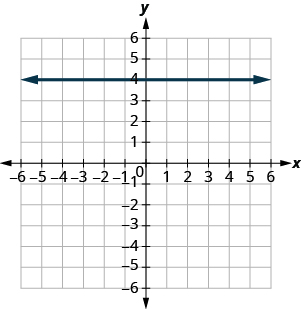
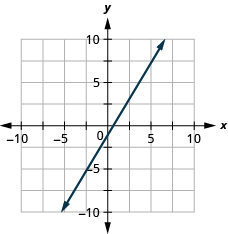
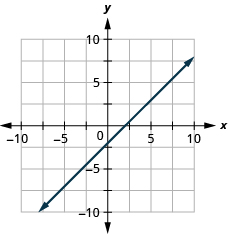
In the following exercises, find the equation of the line shown in each graph. Write the equation in slope–intercept form.
Find an Equation of the Line Given the Slope and a Point
In the following exercises, find the equation of a line with given slope and containing the given point. Write the equation in slope–intercept form.
Horizontal line containing
Find an Equation of the Line Given Two Points
In the following exercises, find the equation of a line containing the given points. Write the equation in slope–intercept form.
Find an Equation of a Line Parallel to a Given Line
In the following exercises, find an equation of a line parallel to the given line and contains the given point. Write the equation in slope–intercept form.
line , point
line , point
Find an Equation of a Line Perpendicular to a Given Line
In the following exercises, find an equation of a line perpendicular to the given line and contains the given point. Write the equation in slope–intercept form.
line , point
line , point
Verify Solutions to an Inequality in Two Variables
In the following exercises, determine whether each ordered pair is a solution to the given inequality.
Determine whether each ordered pair is a solution to the inequality :
ⓐ
ⓑ
ⓒ
ⓓ
ⓔ
Determine whether each ordered pair is a solution to the inequality :
ⓐ
ⓑ
ⓒ
ⓓ
ⓔ
ⓐ yes ⓑ no ⓒ yes ⓓ yes ⓔ no
Recognize the Relation Between the Solutions of an Inequality and its Graph
In the following exercises, write the inequality shown by the shaded region.
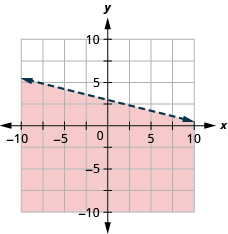
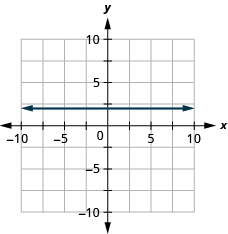
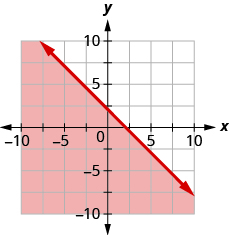
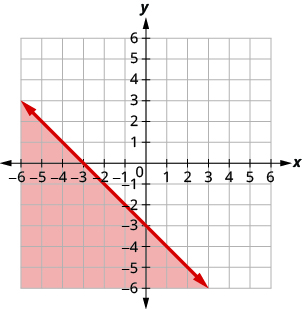
Write the inequality shown by the graph with the boundary line .
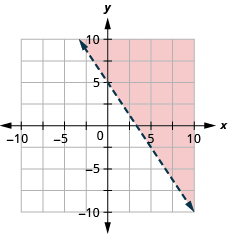
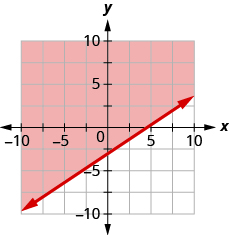
Write the inequality shown by the graph with the boundary line .
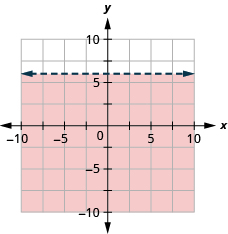
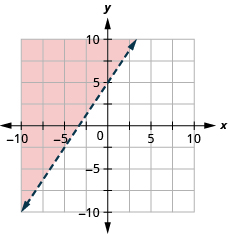
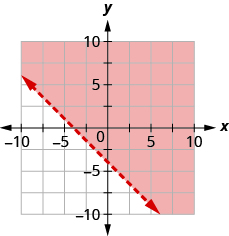
Write the inequality shown by the shaded region in the graph with the boundary line .
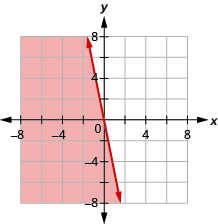
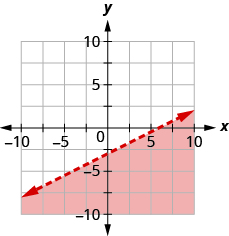
Write the inequality shown by the shaded region in the graph with the boundary line
Graph Linear Inequalities
In the following exercises, graph each linear inequality.
Graph the linear inequality .
Graph the linear inequality .
Graph the linear inequality .
Plot each point in a rectangular coordinate system.
ⓐ
ⓑ
ⓒ
ⓓ
ⓔ
Which of the given ordered pairs are solutions to the equation ?
ⓐ
ⓑ
ⓒ
ⓐ yes ⓑ yes ⓒ no
Find three solutions to the linear equation .
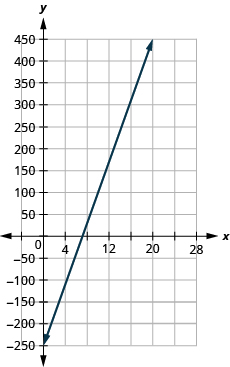
Find the slope of each line shown.
Graph the line with slope containing the point .
Graph the line for each of the following equations.
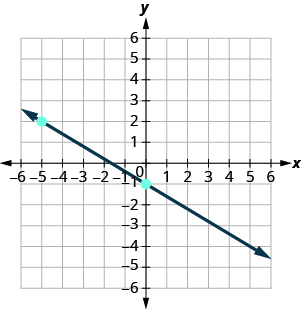
Find the equation of each line. Write the equation in slope–intercept form.
parallel to the line , containing the point
Write the inequality shown by the graph with the boundary line .
Graph each linear inequality.
Notification Switch
Would you like to follow the 'Elementary algebra' conversation and receive update notifications?

|
|

|
|

|
|
|
|
|

|
|

|
|

|
|
|
|
|

|
|

|