| << Chapter < Page | Chapter >> Page > |
The slope of the line between two points and is
This is the slope formula .
The slope is:
Use the slope formula to find the slope of the line between the points and .
Let’s confirm this by counting out the slope on a graph using .
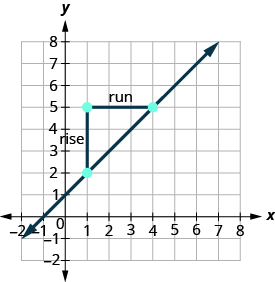
It doesn’t matter which point you call point #1 and which one you call point #2. The slope will be the same. Try the calculation yourself.
Use the slope formula to find the slope of the line through the points: and .
1
Use the slope formula to find the slope of the line through the points: and .
1
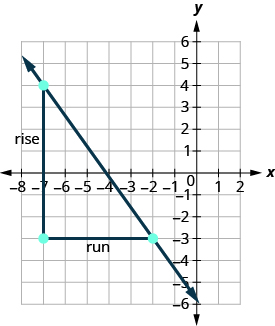
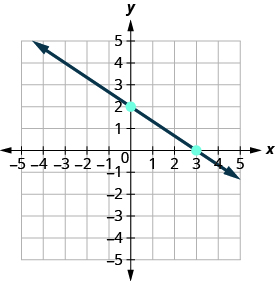
Use the slope formula to find the slope of the line through the points and .
Let’s verify this slope on the graph shown.
Use the slope formula to find the slope of the line through the points: and
Use the slope formula to find the slope of the line through the pair of points: and .
10
Up to now, in this chapter, we have graphed lines by plotting points, by using intercepts, and by recognizing horizontal and vertical lines.
One other method we can use to graph lines is called the point–slope method . We will use this method when we know one point and the slope of the line. We will start by plotting the point and then use the definition of slope to draw the graph of the line.
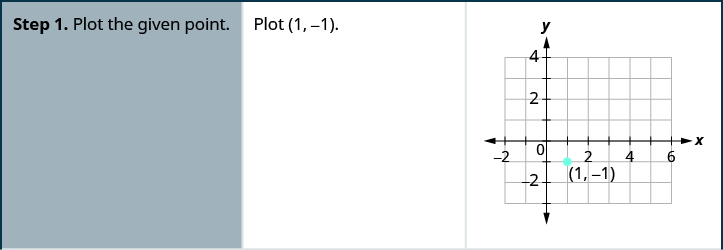
Graph the line passing through the point whose slope is .
Graph the line with y -intercept 2 whose slope is .
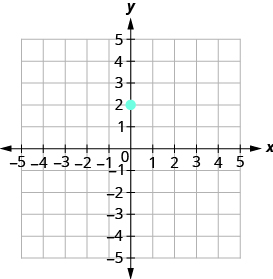
Plot the given point, the y -intercept, .
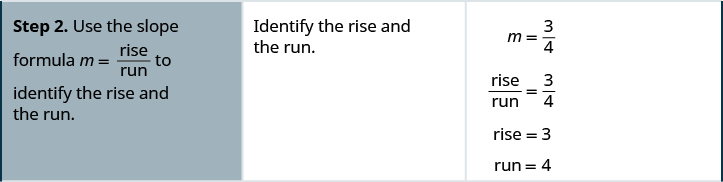
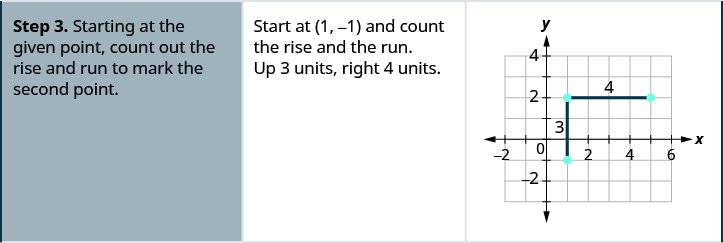
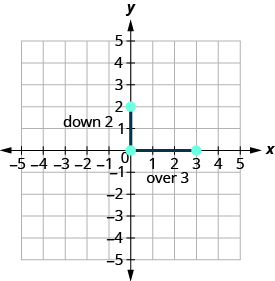
Count the rise and the run. Mark the second point.
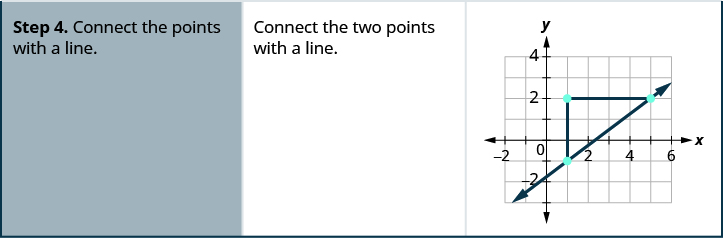
Connect the two points with a line.
You can check your work by finding a third point. Since the slope is , it can be written as . Go back to and count out the rise, 2, and the run, .
Notification Switch
Would you like to follow the 'Elementary algebra' conversation and receive update notifications?

|
|

|
|

|
|

|
|

|
|
|
|
|
|
|
|

|
|

|
|
|
|