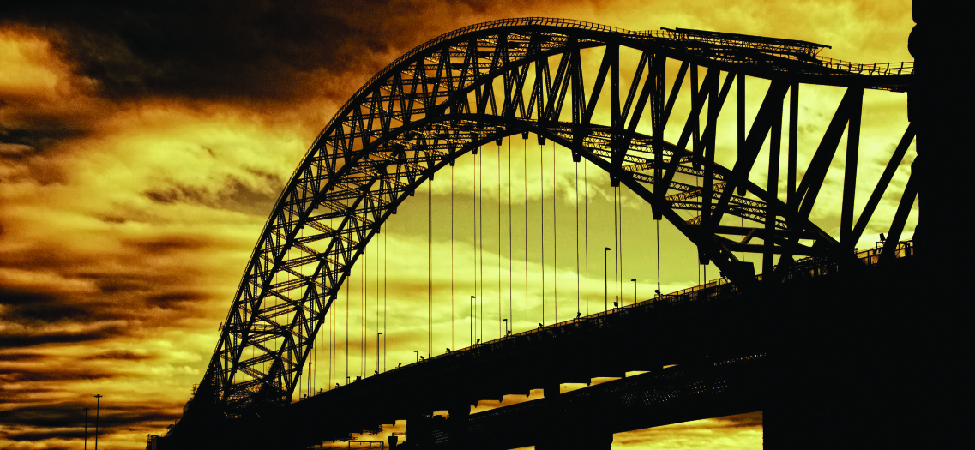
Architects use polynomials to design curved shapes such as this suspension bridge, the Silver Jubilee bridge in Halton, England.
We have seen that the graphs of linear equations are straight lines. Graphs of other types of equations, called polynomial equations, are curves, like the outline of this suspension bridge. Architects use polynomials to design the shape of a bridge like this and to draw the blueprints for it. Engineers use polynomials to calculate the stress on the bridge’s supports to ensure they are strong enough for the intended load. In this chapter, you will explore operations with and properties of polynomials.
Step 1: Find the mean. To find the mean, add up all the scores, then divide them by the number of scores. ...
Step 2: Find each score's deviation from the mean. ...
Step 3: Square each deviation from the mean. ...
Step 4: Find the sum of squares. ...
Step 5: Divide the sum of squares by n – 1 or N.
The sample of 16 students is taken. The average age in the sample was 22 years with astandard deviation of 6 years. Construct a 95% confidence interval for the age of the population.
Bhartdarshan' is an internet-based travel agency wherein customer can see videos of the cities they plant to visit. The number of hits daily is a normally distributed random variable with a mean of 10,000 and a standard deviation of 2,400
a. what is the probability of getting more than 12,000 hits?
b. what is the probability of getting fewer than 9,000 hits?
Bhartdarshan'is an internet-based travel agency wherein customer can see videos of the cities they plan to visit. The number of hits daily is a normally distributed random variable with a mean of 10,000 and a standard deviation of 2,400.
a. What is the probability of getting more than 12,000 hits