| << Chapter < Page | Chapter >> Page > |
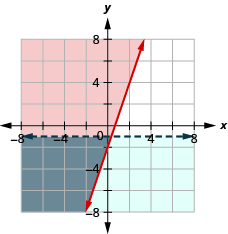
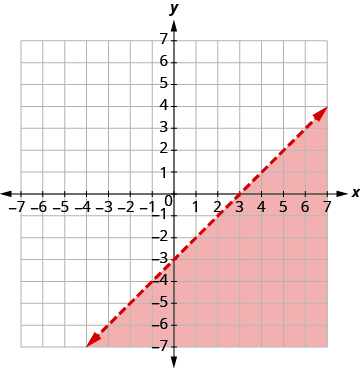
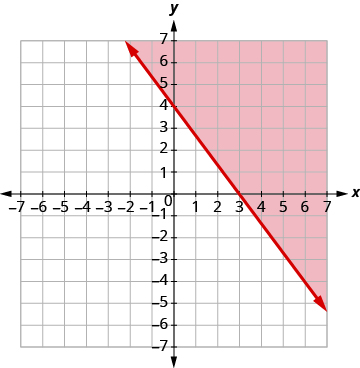
Solve the system by graphing.
| Graph
x −
y >3, by graphing
x −
y = 3 and
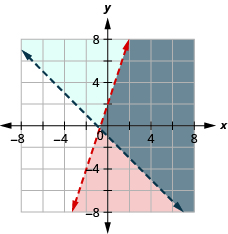
testing a point. The intercepts are x = 3 and y = −3 and the boundary line will be dashed. Test (0, 0). It makes the inequality false. So, shade the side that does not contain (0, 0) red. |
 |
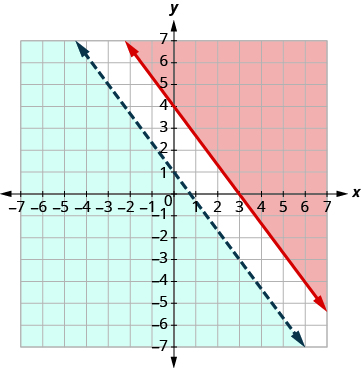
| Graph
by graphing
using the slope and y −intercept b = 4. The boundary line will be dashed. Test (0, 0). It makes the inequality true, so shade the side that contains (0, 0) blue. Choose a test point in the solution and verify that it is a solution to both inequalities. |
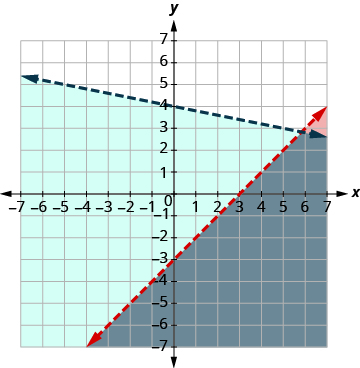 |
The point of intersection of the two lines is not included as both boundary lines were dashed. The solution is the area shaded twice which is the darker-shaded region.
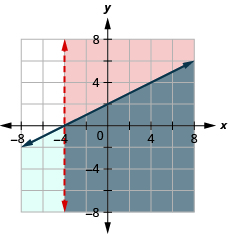
Solve the system by graphing.
| Graph
, by graphing
and testing a point.
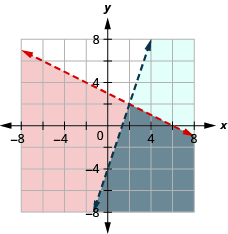
The intercepts are x = 5 and y = −2.5 and the boundary line will be dashed. Test (0, 0). It makes the inequality true. So, shade the side that contains (0, 0) red. |
 |
| Graph
y >−4, by graphing
y = −4 and recognizing that it is a
horizontal line through y = −4. The boundary line will be dashed. Test (0, 0). It makes the inequality true. So, shade (blue) the side that contains (0, 0) blue. |
 |
The point (0, 0) is in the solution and we have already found it to be a solution of each inequality. The point of intersection of the two lines is not included as both boundary lines were dashed.
The solution is the area shaded twice which is the darker-shaded region.
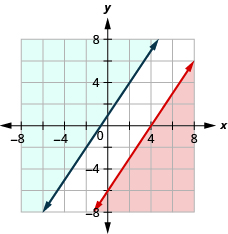
Systems of linear inequalities where the boundary lines are parallel might have no solution. We’ll see this in [link] .
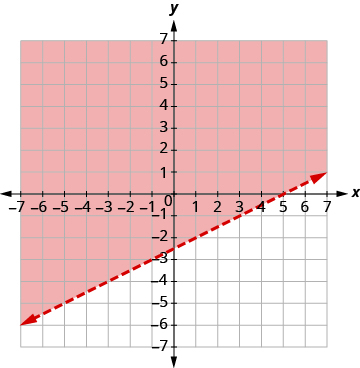
Solve the system by graphing.
| Graph
, by graphing
and testing a point.
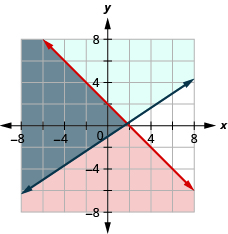
The intercepts are x = 3 and y = 4 and the boundary line will be solid. Test (0, 0). It makes the inequality false. So, shade the side that does not contain (0, 0) red. |
 |
| Graph
by graphing
using the
slope and the y -intercept b = 1. The boundary line will be dashed. Test (0, 0). It makes the inequality true. So, shade the side that contains (0, 0) blue. |
 |
There is no point in both shaded regions, so the system has no solution. This system has no solution.
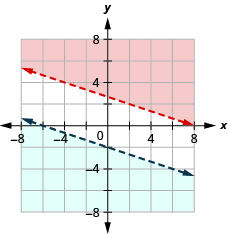
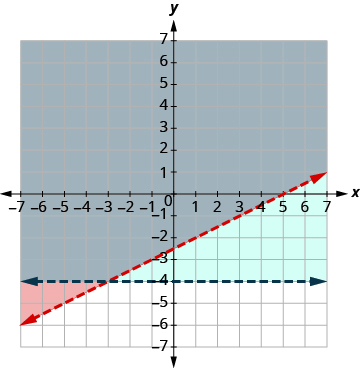
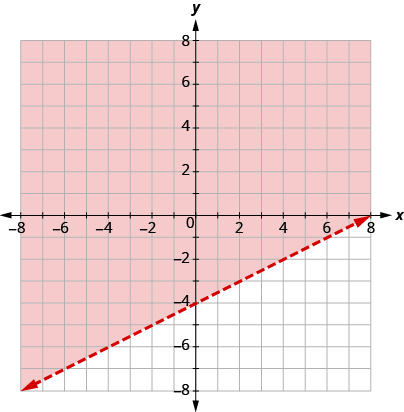
Solve the system by graphing.
| Graph
by graphing
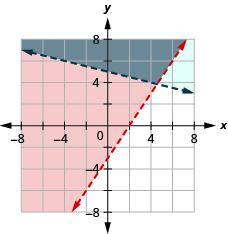
using the slope and the intercept b = −4. The boundary line will be dashed. Test (0, 0). It makes the inequality true. So, shade the side that contains (0, 0) red. |
 |
| Graph
by graphing
and testing a point.
The intercepts are x = −4 and y = 2 and the boundary line will be dashed. Choose a test point in the solution and verify that it is a solution to both inequalities. |
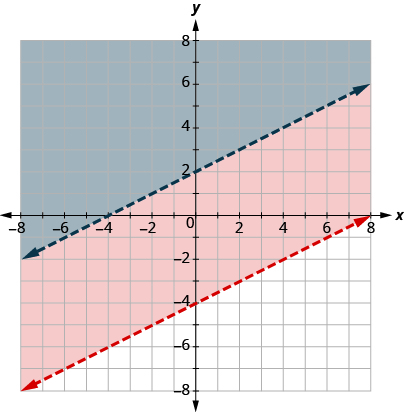 |
No point on the boundary lines is included in the solution as both lines are dashed.
The solution is the region that is shaded twice, which is also the solution to .
Notification Switch
Would you like to follow the 'Elementary algebra' conversation and receive update notifications?

|
|

|
|

|
|
|
|
|

|
|

|
|

|
|

|
|

|
|

|