<< Chapter < Page Chapter >> Page >
By the end of this section, you will be able to:
  • Determine whether an ordered pair is a solution of a system of linear inequalities
  • Solve a system of linear inequalities by graphing
  • Solve applications of systems of inequalities

Before you get started, take this readiness quiz.

  1. Graph x > 2 on a number line.
    If you missed this problem, review [link] .
  2. Solve the inequality 2 a < 5 a + 12 .
    If you missed this problem, review [link] .
  3. Determine whether the ordered pair ( 3 , 1 2 ) is a solution to the system { x + 2 y = 4 y = 6 x .
    If you missed this problem, review [link]


Determine whether an ordered pair is a solution of a system of linear inequalities

The definition of a system of linear inequalities is very similar to the definition of a system of linear equations.

System of linear inequalities

Two or more linear inequalities grouped together form a system of linear inequalities    .

A system of linear inequalities looks like a system of linear equations, but it has inequalities instead of equations. A system of two linear inequalities is shown below.

{ x + 4 y 10 3 x 2 y < 12

To solve a system of linear inequalities, we will find values of the variables that are solutions to both inequalities. We solve the system by using the graphs of each inequality and show the solution as a graph. We will find the region on the plane that contains all ordered pairs ( x , y ) that make both inequalities true.

Solutions of a system of linear inequalities

Solutions of a system of linear inequalities are the values of the variables that make all the inequalities true.

The solution of a system of linear inequalities is shown as a shaded region in the x-y coordinate system that includes all the points whose ordered pairs make the inequalities true.

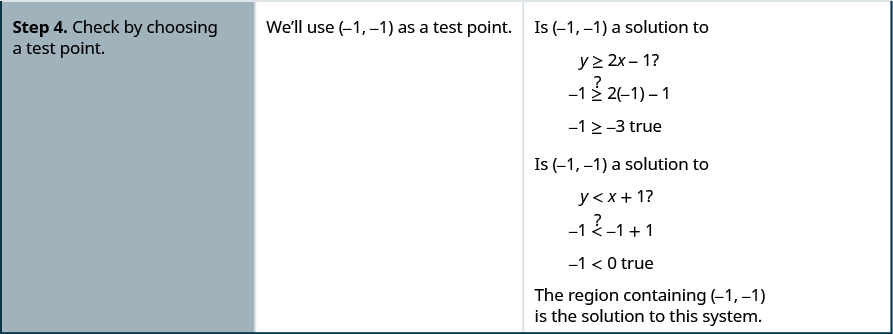
To determine if an ordered pair is a solution to a system of two inequalities, we substitute the values of the variables into each inequality. If the ordered pair makes both inequalities true, it is a solution to the system.

Determine whether the ordered pair is a solution to the system. { x + 4 y 10 3 x 2 y < 12

(−2, 4) (3,1)

Solution

  1. Is the ordered pair (−2, 4) a solution?
    This figure says, “We substitute x = -2 and y = 4 into both inequalities. The first inequality, x + 4 y is greater than or equal to 10 becomes -2 plus 4 times 4 is greater than or less than 10 or 14 is great than or less than 10 which is true. The second inequality, 3x – 2y is less than 12 becomes 3 times -2 – 2 times 4 is less than 12 or  -14 is less than 12 which is true.

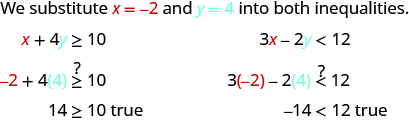
The ordered pair (−2, 4) made both inequalities true. Therefore (−2, 4) is a solution to this system.

  1. Is the ordered pair (3,1) a solution?
    This figure says, “We substitute x  3 and y = 1 into both inequalities.” The first inequality, x + 4y  is greater than or equal to 10 becomes 3 + 4 times 1 is greater than or equal to 10 or y is greater than or equal to 10 which is false. The second inequality, 3x -2y is less than 12 becomes 3 times 3 – two times 1 is less than 12 or 7 is less than 12 which is true.

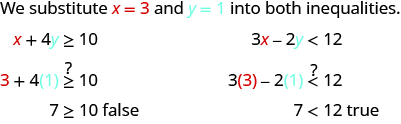
The ordered pair (3,1) made one inequality true, but the other one false. Therefore (3,1) is not a solution to this system.

Got questions? Get instant answers now!

Determine whether the ordered pair is a solution to the system.
{ x 5 y > 10 2 x + 3 y > −2

( 3 , −1 ) ( 6 , −3 )

no yes

Got questions? Get instant answers now!

Determine whether the ordered pair is a solution to the system.
{ y > 4 x 2 4 x y < 20

( 2 , 1 ) ( 4 , −1 )

no no

Got questions? Get instant answers now!

Solve a system of linear inequalities by graphing

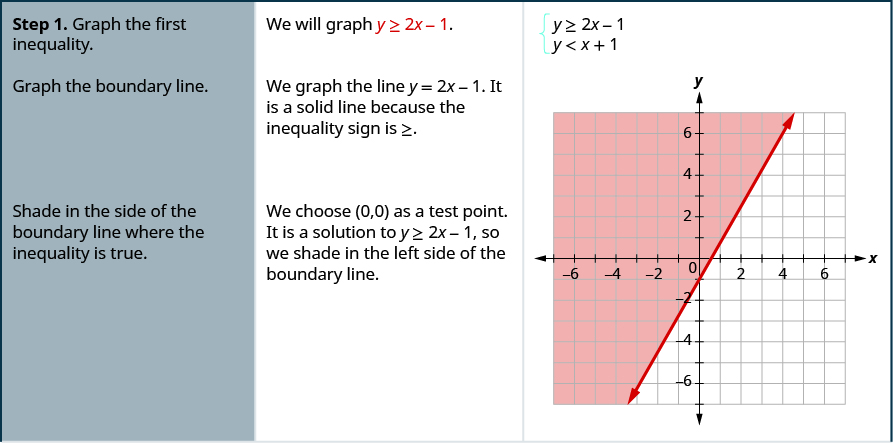
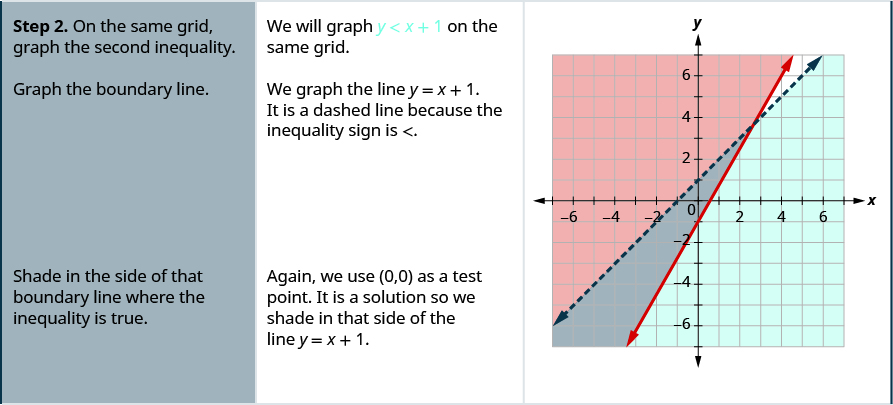
The solution to a single linear inequality is the region on one side of the boundary line that contains all the points that make the inequality true. The solution to a system of two linear inequalities is a region that contains the solutions to both inequalities. To find this region, we will graph each inequality separately and then locate the region where they are both true. The solution is always shown as a graph.

How to solve a system of linear inequalities

Solve the system by graphing.

{ y 2 x 1 y < x + 1

Solution

This is a table with three columns and several rows. The first row says, “Step 1: Graph the first inequality. We will graph y is greater than or equal to 2x – 1.” There are two equations givens, y is greater than or equal to 2x – 1 and y is less than x + 1. The table then reads, “Graph the boundary line. We graph the line y = 2x – 1. It is a solid line because the inequality sign is greater than or equal to. Shade in the side of the boundary line where the inequality is true. We choose (0, 0) as a test point. It is a solution to y is greater than or equal to 2x – 1, so we shad in the left side of the boundary line.” There is a figure of a line graphed on an x y coordinate plane. The area to the left of the line is shaded. The second row then says, “Step 2: On the same grid, graph the second inequality. We will graph y is less than x + 1 on the same grid. Grph the boundary line. We graph the lin y = x + 1. It is a dashed line because the inequality sign is less than. There is a graph which shows two lines graphed on an x y coordinate plane. The area to the left of one line is shaded. The area to the right of the second line is shaded. There is a small area where the shaded areas overlap. The table then says, “Shade in the side of that boundary line where the inequality is true. Again we use (0, 0) as a test point. It is a solution so we shade in that side of the line y = x + 1. The third row then says, “Step 3: The solution is the region where the shading overlaps. The poing where the boundary lines intersect is not a solution because it is not a solution to y is less than x + 1. The solution is all points in the purple shaded region.” The fourth row then says, “Step 4: Check by choosing a test point. We’ll use (-1, -1) as a test point. Is (-1, -1) a solution to y is greater than or equal to 2x – 1? -1 is greater than or equal to 2 times -1 – 1 or -1 is greater than or equal to -3 true.”
Got questions? Get instant answers now!

Questions & Answers

how do you get the 2/50
Abba Reply
number of sport play by 50 student construct discrete data
Aminu Reply
width of the frangebany leaves on how to write a introduction
Theresa Reply
Solve the mean of variance
Veronica Reply
Step 1: Find the mean. To find the mean, add up all the scores, then divide them by the number of scores. ... Step 2: Find each score's deviation from the mean. ... Step 3: Square each deviation from the mean. ... Step 4: Find the sum of squares. ... Step 5: Divide the sum of squares by n – 1 or N.
kenneth
what is error
Yakuba Reply
Is mistake done to something
Vutshila
Hy
anas
hy
What is the life teble
anas
hy
Jibrin
statistics is the analyzing of data
Tajudeen Reply
what is statics?
Zelalem Reply
how do you calculate mean
Gloria Reply
diveving the sum if all values
Shaynaynay
let A1,A2 and A3 events be independent,show that (A1)^c, (A2)^c and (A3)^c are independent?
Fisaye Reply
what is statistics
Akhisani Reply
data collected all over the world
Shaynaynay
construct a less than and more than table
Imad Reply
The sample of 16 students is taken. The average age in the sample was 22 years with astandard deviation of 6 years. Construct a 95% confidence interval for the age of the population.
Aschalew Reply
Bhartdarshan' is an internet-based travel agency wherein customer can see videos of the cities they plant to visit. The number of hits daily is a normally distributed random variable with a mean of 10,000 and a standard deviation of 2,400 a. what is the probability of getting more than 12,000 hits? b. what is the probability of getting fewer than 9,000 hits?
Akshay Reply
Bhartdarshan'is an internet-based travel agency wherein customer can see videos of the cities they plan to visit. The number of hits daily is a normally distributed random variable with a mean of 10,000 and a standard deviation of 2,400. a. What is the probability of getting more than 12,000 hits
Akshay
1
Bright
Sorry i want to learn more about this question
Bright
Someone help
Bright
a= 0.20233 b=0.3384
Sufiyan
a
Shaynaynay
How do I interpret level of significance?
Mohd Reply
It depends on your business problem or in Machine Learning you could use ROC- AUC cruve to decide the threshold value
Shivam
how skewness and kurtosis are used in statistics
Owen Reply
yes what is it
Taneeya
Got questions? Join the online conversation and get instant answers!
Jobilize.com Reply
Practice Key Terms 1

Get Jobilize Job Search Mobile App in your pocket Now!

Get it on Google Play Download on the App Store Now


Source:  OpenStax, Elementary algebra. OpenStax CNX. Jan 18, 2017 Download for free at http://cnx.org/content/col12116/1.2
Google Play and the Google Play logo are trademarks of Google Inc.

Notification Switch

Would you like to follow the 'Elementary algebra' conversation and receive update notifications?

Ask