A museum charges $5 per person for a guided tour with a group of 1 to 9 people or a fixed $50 fee for a group of 10 or more people. Write a
function relating the number of people,
to the cost,
Two different formulas will be needed. For
n -values under 10,
For values of
that are 10 or greater,
A cell phone company uses the function below to determine the cost,
in dollars for
gigabytes of data transfer.
Find the cost of using 1.5 gigabytes of data and the cost of using 4 gigabytes of data.
To find the cost of using 1.5 gigabytes of data,
we first look to see which part of the domain our input falls in. Because 1.5 is less than 2, we use the first formula.
To find the cost of using 4 gigabytes of data,
we see that our input of 4 is greater than 2, so we use the second formula.
Indicate on the
x -axis the boundaries defined by the intervals on each piece of the domain.
For each piece of the domain, graph on that interval using the corresponding equation pertaining to that piece. Do not graph two functions over one interval because it would violate the criteria of a function.
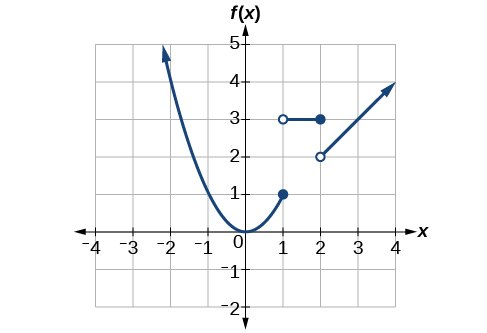
Graphing a piecewise function
Sketch a graph of the function.
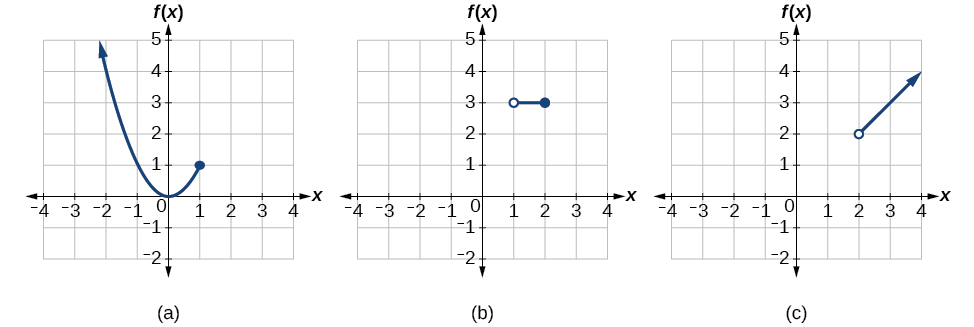
Each of the component functions is from our library of toolkit functions, so we know their shapes. We can imagine graphing each function and then limiting the graph to the indicated domain. At the endpoints of the domain, we draw open circles to indicate where the endpoint is not included because of a less-than or greater-than inequality; we draw a closed circle where the endpoint is included because of a less-than-or-equal-to or greater-than-or-equal-to inequality.
[link] shows the three components of the piecewise function graphed on separate coordinate systems.
(a)
(b)
(c)
Now that we have sketched each piece individually, we combine them in the same coordinate plane. See
[link] .
The domain of a function includes all real input values that would not cause us to attempt an undefined mathematical operation, such as dividing by zero or taking the square root of a negative number.
The domain of a function can be determined by listing the input values of a set of ordered pairs. See
[link] .
The domain of a function can also be determined by identifying the input values of a function written as an equation. See
[link] ,
[link] , and
[link] .
Interval values represented on a number line can be described using inequality notation, set-builder notation, and interval notation. See
[link] .
For many functions, the domain and range can be determined from a graph. See
[link] and
[link] .
An understanding of toolkit functions can be used to find the domain and range of related functions. See
[link] ,
[link] , and
[link] .
A piecewise function is described by more than one formula. See
[link] and
[link] .
A piecewise function can be graphed using each algebraic formula on its assigned subdomain. See
[link] .
is it possible to leave every good at the same level
Joseph
I don't think so. because check it, if the demand for chicken increases, people will no longer consume fish like they used to causing a fall in the demand for fish
Anuolu
is not really possible to let the value of a goods to be same at the same time.....
Salome
Suppose the inflation rate is 6%, does it mean that all the goods you purchase will cost
6% more than previous year? Provide with reasoning.
Not necessarily. To measure the inflation rate economists normally use an averaged price index of a basket of certain goods. So if you purchase goods included in the basket, you will notice that you pay 6% more, otherwise not necessarily.
Good day
How do I calculate this question: C= 100+5yd G= 2000 T= 2000 I(planned)=200.
Suppose the actual output is 3000. What is the level of planned expenditures at this level of output?
I am Camara from Guinea west Africa... happy to meet you guys here
Sekou
ma management ho
Amisha
ahile becheclor ho
Amisha
hjr ktm bta ho
ani k kaam grnu hunxa tw
Amisha
belatari
Amisha
1st year ho
Amisha
nd u
Amisha
ahh
Amisha
kaha biratnagar
Amisha
ys
Amisha
kina k vo
Amisha
money as unit of account means what?
Kalombe
A unit of account is something that can be used to value goods and services and make calculations
Jim
all of you please speak in English I can't understand you're language
Muhammad
I want to know how can we define macroeconomics in one line
Muhammad
it must be .9 or 0.9
no Mpc is greater than 1
Y=100+.9Y+50
Y-.9Y=150
0.1Y/0.1=150/0.1
Y=1500
Kalombe
Mercy is it clear?😋
Kalombe
hi can someone help me on this question
If a negative shocks shifts the IS curve to the left, what type of policy do you suggest so as to stabilize the level of output?
discuss your answer using appropriate graph.