<< Chapter < Page Chapter >> Page >
This figure shows three graphs labeled a, b, and c. Graph a shows an increasing function (f) along the x-axis and the y-axis which is labeled f of x. Graph b shows a decreasing function (f) along the x-axis and y-axis which is labeled f of x. Graph c shows a constant function (f) along the x-axis and y-axis which is labeled f of x. The constant function is horizontal. None of the graphs have any increments labeled on the x- or y-axis.

Increasing and decreasing functions

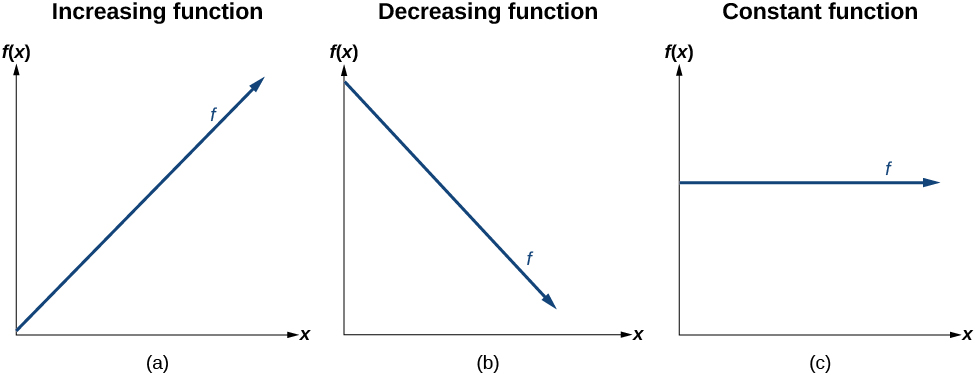
The slope determines if the function is an increasing linear function    , a decreasing linear function    , or a constant function.

  • f ( x ) = m x + b is an increasing function if m > 0.
  • f ( x ) = m x + b is a decreasing function if m < 0.
  • f ( x ) = m x + b is a constant function if m = 0.

Deciding whether a function is increasing, decreasing, or constant

Some recent studies suggest that a teenager sends an average of 60 texts per day http://www.cbsnews.com/8301-501465_162-57400228-501465/teens-are-sending-60-texts-a-day-study-says/ . For each of the following scenarios, find the linear function that describes the relationship between the input value and the output value. Then, determine whether the graph of the function is increasing, decreasing, or constant.

  1. The total number of texts a teen sends is considered a function of time in days. The input is the number of days, and output is the total number of texts sent.
  2. A teen has a limit of 500 texts per month in his or her data plan. The input is the number of days, and output is the total number of texts remaining for the month.
  3. A teen has an unlimited number of texts in his or her data plan for a cost of $50 per month. The input is the number of days, and output is the total cost of texting each month.

Analyze each function.

  1. The function can be represented as f ( x ) = 60 x where x is the number of days. The slope, 60, is positive so the function is increasing. This makes sense because the total number of texts increases with each day.
  2. The function can be represented as f ( x ) = 500 60 x where x is the number of days. In this case, the slope is negative so the function is decreasing. This makes sense because the number of texts remaining decreases each day and this function represents the number of texts remaining in the data plan after x days.
  3. The cost function can be represented as f ( x ) = 50 because the number of days does not affect the total cost. The slope is 0 so the function is constant.
Got questions? Get instant answers now!

Interpreting slope as a rate of change

In the examples we have seen so far, the slope was provided to us. However, we often need to calculate the slope given input and output values. Recall that given two values for the input, x 1 and x 2 , and two corresponding values for the output, y 1 and y 2 —which can be represented by a set of points, ( x 1 y 1 ) and ( x 2 y 2 ) —we can calculate the slope m .

m = change in output (rise) change in input (run) = Δ y Δ x = y 2 y 1 x 2 x 1

Note that in function notation we can obtain two corresponding values for the output y 1 and y 2 for the function f , y 1 = f ( x 1 ) and y 2 = f ( x 2 ) , so we could equivalently write

m = f ( x 2 ) f ( x 1 ) x 2 x 1

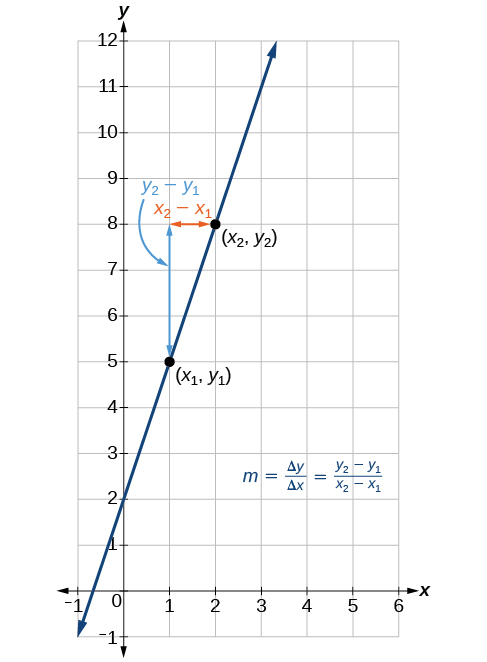
[link] indicates how the slope of the line between the points, ( x 1 , y 1 ) and ( x 2 , y 2 ) , is calculated. Recall that the slope measures steepness, or slant. The greater the absolute value of the slope, the steeper the slant is.

This graph shows how to calculate the slope of a line. The line is graphed on an x y coordinate plane. The x-axis is labeled from negative 1 to 6. The y-axis is labeled from negative 1 to 10. The line passes through several points, but two are marked specifcally. The first is labeled (x subscript 1, y subscript 1). It is located at the point (1, 5). The second point is labeled (x subscript 2, y subscript 2). It is located at the point (2, 8). There is a small arrow that runs horizontally from point (2, 8) to point (1, 8). This arrow is labeled x subscript 2 minus x subscript 1. There is a blue arrow that runs vertically from point (1, 5) to point (1, 8) and is labeled y subscript 2 minus y subscript 1. Off to the side is the equation m equals delta y divided by delta x which equals y subscript 2 minus y subscript 1 divided by x subscript 2 minus x subscript 1.
The slope of a function is calculated by the change in y divided by the change in x . It does not matter which coordinate is used as the ( x 2 , y 2 ) and which is the ( x 1 , y 1 ) , as long as each calculation is started with the elements from the same coordinate pair.

Questions & Answers

summarize halerambos & holbon
David Reply
the Three stages of Auguste Comte
Clementina Reply
what are agents of socialization
Antonio Reply
sociology of education
Nuhu Reply
definition of sociology of education
Nuhu
what is culture
Abdulrahim Reply
shared beliefs, values, and practices
AI-Robot
What are the two type of scientific method
ogunniran Reply
I'm willing to join you
Aceng Reply
what are the scientific method of sociology
Man
what is socialization
ogunniran Reply
the process wherein people come to understand societal norms and expectations, to accept society's beliefs, and to be aware of societal values
AI-Robot
scientific method in doing research
ogunniran
defimition of sickness in afica
Anita
Cosmology
ogunniran
Hmmm
ogunniran
list and explain the terms that found in society
REMMY Reply
list and explain the terms that found in society
Mukhtar
what are the agents of socialization
Antonio
Family Peer group Institution
Abdulwajud
I mean the definition
Antonio
ways of perceived deviance indifferent society
Naomi Reply
reasons of joining groups
SAM
to bring development to the nation at large
Hyellafiya
entails of consultative and consensus building from others
Gadama
World first Sociologist?
Abu
What is evolutionary model
Muhammad Reply
Evolution models refer to mathematical and computational representations of the processes involved in biological evolution. These models aim to simulate and understand how species change over time through mechanisms such as natural selection, genetic drift, and mutation. Evolutionary models can be u
faruk
what are the modern trends in religious behaviours
Selekeye Reply
what are social norms
Daniel Reply
shared standards of acceptable behavior by the group or appropriate behavior in a particular institution or those behaviors that are acceptable in a society
Lucius
that is how i understood it
Lucius
examples of societal norms
Diamond
Discuss the characteristics of the research located within positivist and the interpretivist paradigm
Tariro Reply
what is Industrialisation
Selekeye Reply
industrialization
Angelo
Got questions? Join the online conversation and get instant answers!
Jobilize.com Reply

Get Jobilize Job Search Mobile App in your pocket Now!

Get it on Google Play Download on the App Store Now


Source:  OpenStax, College algebra. OpenStax CNX. Feb 06, 2015 Download for free at https://legacy.cnx.org/content/col11759/1.3
Google Play and the Google Play logo are trademarks of Google Inc.

Notification Switch

Would you like to follow the 'College algebra' conversation and receive update notifications?

Ask