<< Chapter < Page Chapter >> Page >

Write an equation for a line perpendicular to h ( t ) = −2 t + 4 and passing through the point ( −4 , –1 ) .

Got questions? Get instant answers now!

Write an equation for a line perpendicular to p ( t ) = 3 t + 4 and passing through the point ( 3 , 1 ) .

y = 1 3 t + 2

Got questions? Get instant answers now!

Graphical

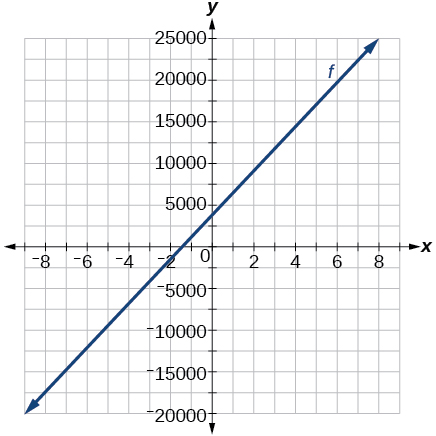
For the following exercises, find the slope of the line graphed.

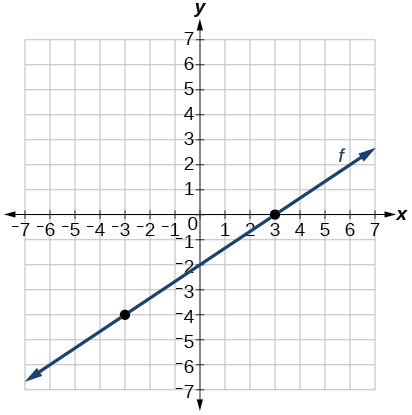
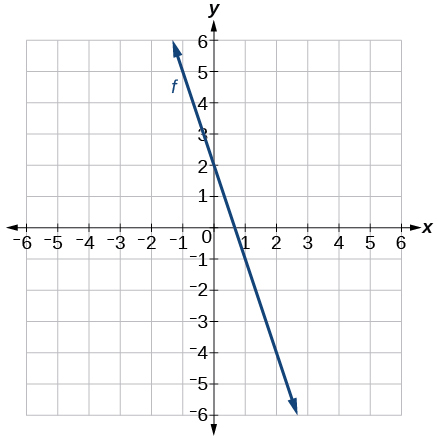
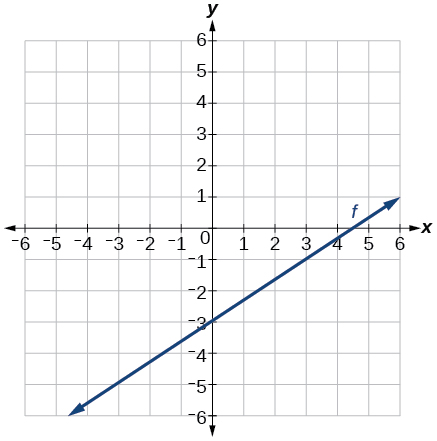
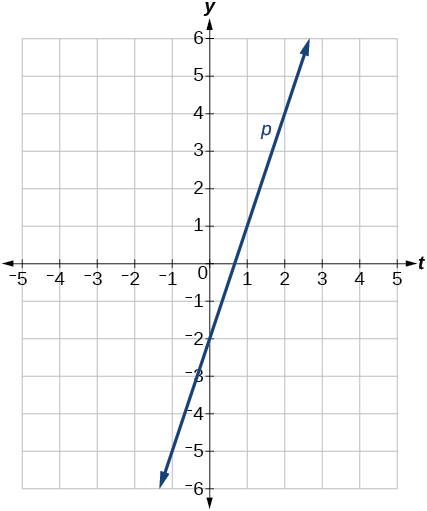
For the following exercises, write an equation for the line graphed.

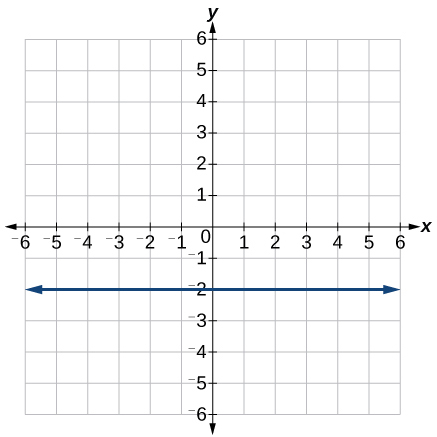
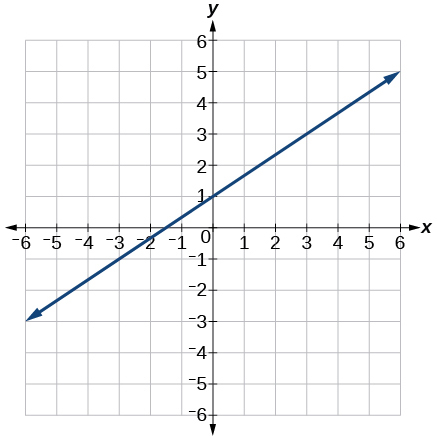
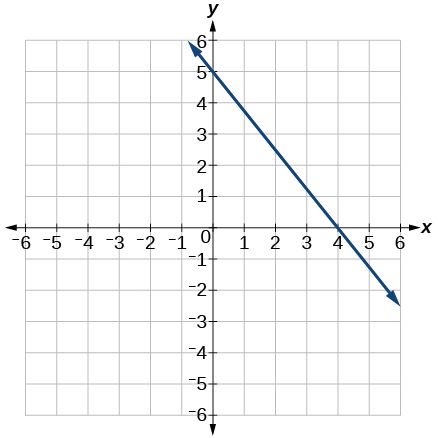
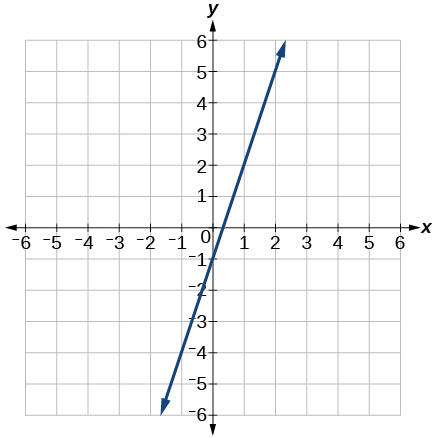
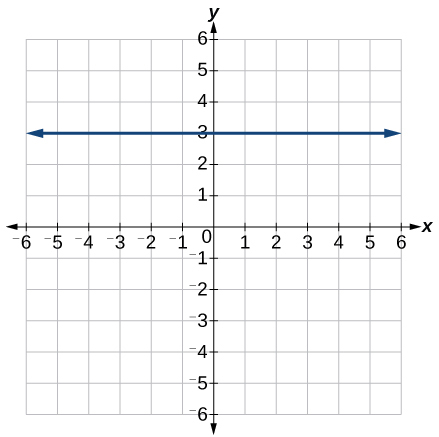
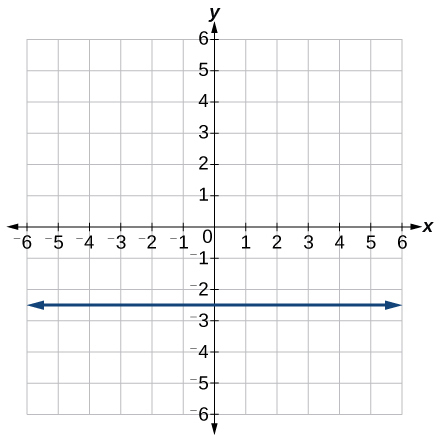
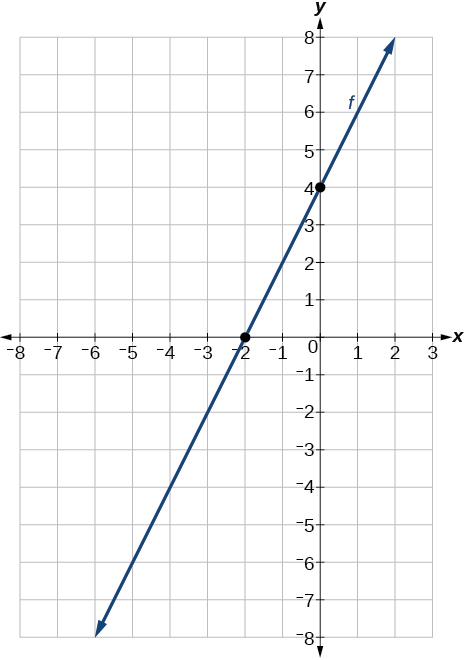
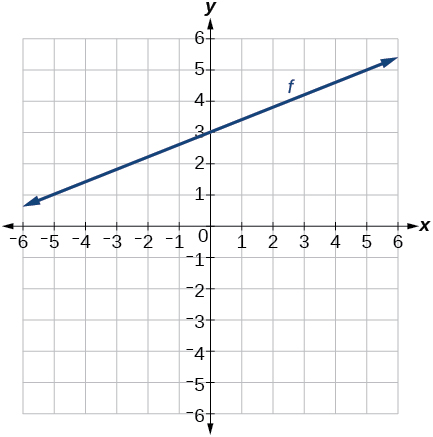
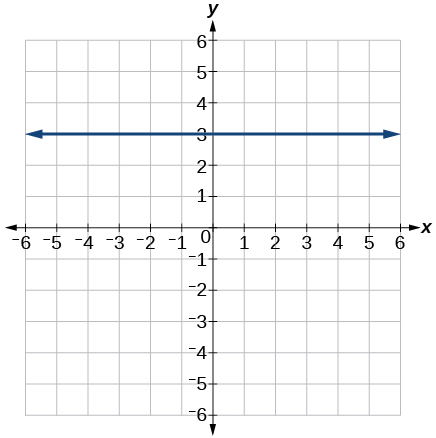
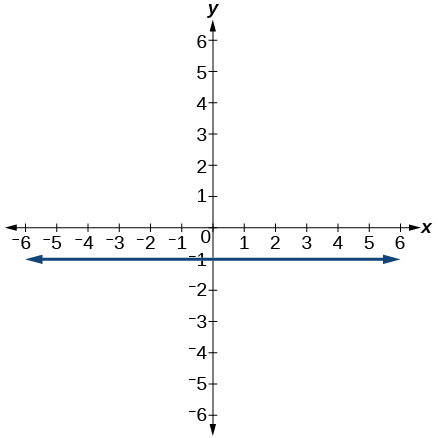
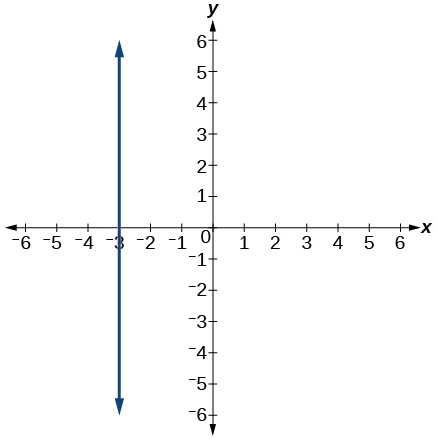
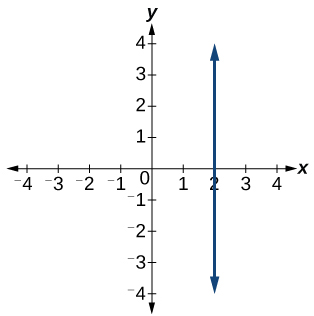
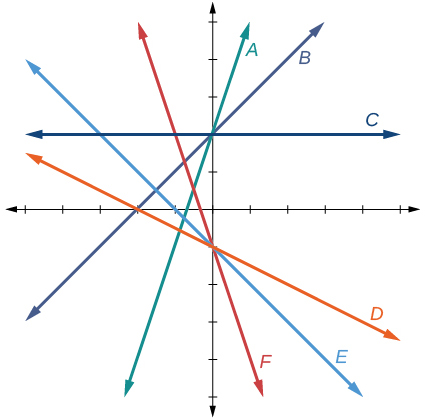
For the following exercises, match the given linear equation with its graph in [link] .

Graph of six functions where line A has a slope of 3 and y-intercept at 2, line B has a slope of 1 and y-intercept at 2, line C has a slope of 0 and y-intercept at 2, line D has a slope of -1/2 and y-intercept at -1, line E has a slope of -1 and y-intercept at -1, and line F has a slope of -2 and y-intercept at -1.

f ( x ) = −2 x 1

F

Got questions? Get instant answers now!

f ( x ) = 1 2 x 1

Got questions? Get instant answers now!

For the following exercises, sketch a line with the given features.

An x -intercept of ( –4 , 0 ) and y -intercept of ( 0 , –2 )

Got questions? Get instant answers now!

An x -intercept ( –2 , 0 ) and y -intercept of ( 0 , 4 )

Graph of f with an x-intercept at -4 and y-intercept at -2 which gives us a slope of: 2.
Got questions? Get instant answers now!

A y -intercept of ( 0 , 7 ) and slope 3 2

Got questions? Get instant answers now!

A y -intercept of ( 0 , 3 ) and slope 2 5

Graph of f with an y-intercept at 3 and a slope of 2/5.
Got questions? Get instant answers now!

Passing through the points ( –6 , –2 ) and ( 6 , –6 )

Got questions? Get instant answers now!

Passing through the points ( –3 , –4 ) and ( 3 , 0 )

Graph of a line that passes through the points (-3, -4) and (3, 0) which results in a slope of 2/3.
Got questions? Get instant answers now!

For the following exercises, sketch the graph of each equation.

For the following exercises, write the equation of the line shown in the graph.

Numeric

For the following exercises, which of the tables could represent a linear function? For each that could be linear, find a linear equation that models the data.

x 0 5 10 15
g ( x ) 5 –10 –25 –40

Linear, g ( x ) = 3 x + 5

Got questions? Get instant answers now!
x 0 5 10 15
h ( x ) 5 30 105 230
Got questions? Get instant answers now!
x 0 5 10 15
f ( x ) –5 20 45 70

Linear, f ( x ) = 5 x 5

Got questions? Get instant answers now!
x 5 10 20 25
k ( x ) 13 28 58 73
Got questions? Get instant answers now!
x 0 2 4 6
g ( x ) 6 –19 –44 –69

Linear, g ( x ) = 25 2 x + 6

Got questions? Get instant answers now!
x 2 4 8 10
h ( x ) 13 23 43 53
Got questions? Get instant answers now!
x 2 4 6 8
f ( x ) –4 16 36 56

Linear, f ( x ) = 10 x 24

Got questions? Get instant answers now!
x 0 2 6 8
k ( x ) 6 31 106 231
Got questions? Get instant answers now!

Technology

For the following exercises, use a calculator or graphing technology to complete the task.

If f is a linear function, f ( 0.1 ) = 11.5 ,   and   f ( 0.4 ) = –5.9 , find an equation for the function.

f ( x ) = 58 x + 17.3

Got questions? Get instant answers now!

Graph the function f on a domain of [ –10 , 10 ] : f ( x ) = 0.02 x 0.01. Enter the function in a graphing utility. For the viewing window, set the minimum value of x to be −10 and the maximum value of x to be 10.

Got questions? Get instant answers now!

Graph the function f on a domain of [ –10 , 10 ] : f x ) = 2 , 500 x + 4 , 000

Graph of f(x) = 2500x + 4000
Got questions? Get instant answers now!

[link] shows the input, w , and output, k , for a linear function k . a. Fill in the missing values of the table. b. Write the linear function k , round to 3 decimal places.

w –10 5.5 67.5 b
k 30 –26 a –44

y = 3.613 x 6.129  

Got questions? Get instant answers now!

[link] shows the input, p , and output, q , for a linear function q . a. Fill in the missing values of the table. b. Write the linear function k .

p 0.5 0.8 12 b
q 400 700 a 1,000,000
Got questions? Get instant answers now!

Graph the linear function f on a domain of [ 10 , 10 ] for the function whose slope is 1 8 and y -intercept is 31 16 . Label the points for the input values of −10 and 10.

Graph of a line with endpoints at (-10, 0.6875) and (10, 3.1875).
Got questions? Get instant answers now!

Graph the linear function f on a domain of [ 0.1 , 0.1 ] for the function whose slope is 75 and y -intercept is −22.5. Label the points for the input values of −0.1 and 0.1.

Got questions? Get instant answers now!

Graph the linear function f where f ( x ) = a x + b on the same set of axes on a domain of [ 4 , 4 ] for the following values of a and b .

  1. a = 2 ; b = 3
  2. a = 2 ; b = 4
  3. a = 2 ; b = –4
  4. a = 2 ; b = –5
Graph of four functions where the blue line is f(x) = 2x+4 which has a slope of 2 and y-intercept of 4, the orange line is f(x) = 2x +3 which has a slope of 2 and a y-intercept of 3, the turquoise line is f(x) = 2x – 4 which has a slope of 2 and a y-intercept of -4, and the red line is f(x) = 2x -5 which has a slope of 2 and a y-intercept of -5.
Got questions? Get instant answers now!

Extensions

Find the value of x if a linear function goes through the following points and has the following slope: ( x , 2 ) , ( −4 , 6 ) , m = 3

Got questions? Get instant answers now!

Find the value of y if a linear function goes through the following points and has the following slope: ( 10 , y ) , ( 25 , 100 ) , m = −5

y = 175

Got questions? Get instant answers now!

Questions & Answers

how do you get the 2/50
Abba Reply
number of sport play by 50 student construct discrete data
Aminu Reply
width of the frangebany leaves on how to write a introduction
Theresa Reply
Solve the mean of variance
Veronica Reply
Step 1: Find the mean. To find the mean, add up all the scores, then divide them by the number of scores. ... Step 2: Find each score's deviation from the mean. ... Step 3: Square each deviation from the mean. ... Step 4: Find the sum of squares. ... Step 5: Divide the sum of squares by n – 1 or N.
kenneth
what is error
Yakuba Reply
Is mistake done to something
Vutshila
Hy
anas
hy
What is the life teble
anas
hy
Jibrin
statistics is the analyzing of data
Tajudeen Reply
what is statics?
Zelalem Reply
how do you calculate mean
Gloria Reply
diveving the sum if all values
Shaynaynay
let A1,A2 and A3 events be independent,show that (A1)^c, (A2)^c and (A3)^c are independent?
Fisaye Reply
what is statistics
Akhisani Reply
data collected all over the world
Shaynaynay
construct a less than and more than table
Imad Reply
The sample of 16 students is taken. The average age in the sample was 22 years with astandard deviation of 6 years. Construct a 95% confidence interval for the age of the population.
Aschalew Reply
Bhartdarshan' is an internet-based travel agency wherein customer can see videos of the cities they plant to visit. The number of hits daily is a normally distributed random variable with a mean of 10,000 and a standard deviation of 2,400 a. what is the probability of getting more than 12,000 hits? b. what is the probability of getting fewer than 9,000 hits?
Akshay Reply
Bhartdarshan'is an internet-based travel agency wherein customer can see videos of the cities they plan to visit. The number of hits daily is a normally distributed random variable with a mean of 10,000 and a standard deviation of 2,400. a. What is the probability of getting more than 12,000 hits
Akshay
1
Bright
Sorry i want to learn more about this question
Bright
Someone help
Bright
a= 0.20233 b=0.3384
Sufiyan
a
Shaynaynay
How do I interpret level of significance?
Mohd Reply
It depends on your business problem or in Machine Learning you could use ROC- AUC cruve to decide the threshold value
Shivam
how skewness and kurtosis are used in statistics
Owen Reply
yes what is it
Taneeya
Got questions? Join the online conversation and get instant answers!
Jobilize.com Reply

Get Jobilize Job Search Mobile App in your pocket Now!

Get it on Google Play Download on the App Store Now


Source:  OpenStax, College algebra. OpenStax CNX. Feb 06, 2015 Download for free at https://legacy.cnx.org/content/col11759/1.3
Google Play and the Google Play logo are trademarks of Google Inc.

Notification Switch

Would you like to follow the 'College algebra' conversation and receive update notifications?

Ask