<< Chapter < Page Chapter >> Page >
In this section you will:
  • Draw and interpret scatter diagrams.
  • Use a graphing utility to find the line of best fit.
  • Distinguish between linear and nonlinear relations.
  • Fit a regression line to a set of data and use the linear model to make predictions.

A professor is attempting to identify trends among final exam scores. His class has a mixture of students, so he wonders if there is any relationship between age and final exam scores. One way for him to analyze the scores is by creating a diagram that relates the age of each student to the exam score received. In this section, we will examine one such diagram known as a scatter plot.

Drawing and interpreting scatter plots

A scatter plot is a graph of plotted points that may show a relationship between two sets of data. If the relationship is from a linear model , or a model that is nearly linear, the professor can draw conclusions using his knowledge of linear functions. [link] shows a sample scatter plot.

Scatter plot, titled 'Final Exam Score VS Age'. The x-axis is the age, and the y-axis is the final exam score. The range of ages are between 20s - 50s, and the range for scores are between upper 50s and 90s.
A scatter plot of age and final exam score variables

Notice this scatter plot does not indicate a linear relationship . The points do not appear to follow a trend. In other words, there does not appear to be a relationship between the age of the student and the score on the final exam.

Using a scatter plot to investigate cricket chirps

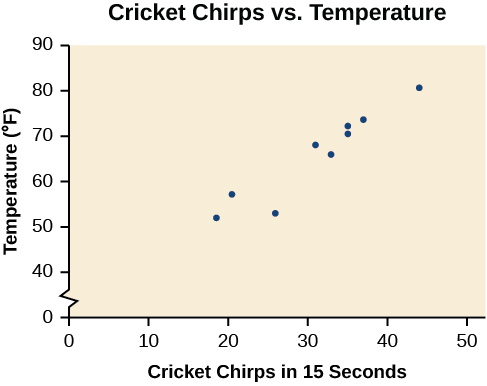
[link] shows the number of cricket chirps in 15 seconds, for several different air temperatures, in degrees Fahrenheit Selected data from http://classic.globe.gov/fsl/scientistsblog/2007/10/. Retrieved Aug 3, 2010 . Plot this data, and determine whether the data appears to be linearly related.

Cricket chirps vs air temperature
Chirps 44 35 20.4 33 31 35 18.5 37 26
Temperature 80.5 70.5 57 66 68 72 52 73.5 53

Plotting this data, as depicted in [link] suggests that there may be a trend. We can see from the trend in the data that the number of chirps increases as the temperature increases. The trend appears to be roughly linear, though certainly not perfectly so.

Scatter plot, titled 'Cricket Chirps vs. Air Temperature'. The x-axis is the Cricket Chirps in 15 Seconds, and the y-axis is the Temperature (F). The line regression is generally positive.
Got questions? Get instant answers now!

Finding the line of best fit

Once we recognize a need for a linear function to model that data, the natural follow-up question is “what is that linear function?” One way to approximate our linear function is to sketch the line that seems to best fit the data. Then we can extend the line until we can verify the y -intercept. We can approximate the slope of the line by extending it until we can estimate the rise run .

Finding a line of best fit

Find a linear function that fits the data in [link] by “eyeballing” a line that seems to fit.

On a graph, we could try sketching a line. Using the starting and ending points of our hand drawn line, points (0, 30) and (50, 90), this graph has a slope of

m = 60 50 = 1.2

and a y -intercept at 30. This gives an equation of

T ( c ) = 1.2 c + 30

where c is the number of chirps in 15 seconds, and T ( c ) is the temperature in degrees Fahrenheit. The resulting equation is represented in [link] .

Scatter plot, showing the line of best fit: T(c) = 1.2c + 30. It is titled 'Cricket Chirps Vs Air Temperature'. The x-axis is 'c, Number of Chirps', and the y-axis is 'T(c), Temperature (F)'.
Got questions? Get instant answers now!

Recognizing interpolation or extrapolation

While the data for most examples does not fall perfectly on the line, the equation is our best guess as to how the relationship will behave outside of the values for which we have data. We use a process known as interpolation when we predict a value inside the domain and range of the data. The process of extrapolation is used when we predict a value outside the domain and range of the data.

Questions & Answers

Ayele, K., 2003. Introductory Economics, 3rd ed., Addis Ababa.
Widad Reply
can you send the book attached ?
Ariel
?
Ariel
What is economics
Widad Reply
the study of how humans make choices under conditions of scarcity
AI-Robot
U(x,y) = (x×y)1/2 find mu of x for y
Desalegn Reply
U(x,y) = (x×y)1/2 find mu of x for y
Desalegn
what is ecnomics
Jan Reply
this is the study of how the society manages it's scarce resources
Belonwu
what is macroeconomic
John Reply
macroeconomic is the branch of economics which studies actions, scale, activities and behaviour of the aggregate economy as a whole.
husaini
etc
husaini
difference between firm and industry
husaini Reply
what's the difference between a firm and an industry
Abdul
firm is the unit which transform inputs to output where as industry contain combination of firms with similar production 😅😅
Abdulraufu
Suppose the demand function that a firm faces shifted from Qd  120 3P to Qd  90  3P and the supply function has shifted from QS  20  2P to QS 10  2P . a) Find the effect of this change on price and quantity. b) Which of the changes in demand and supply is higher?
Toofiq Reply
explain standard reason why economic is a science
innocent Reply
factors influencing supply
Petrus Reply
what is economic.
Milan Reply
scares means__________________ends resources. unlimited
Jan
economics is a science that studies human behaviour as a relationship b/w ends and scares means which have alternative uses
Jan
calculate the profit maximizing for demand and supply
Zarshad Reply
Why qualify 28 supplies
Milan
what are explicit costs
Nomsa Reply
out-of-pocket costs for a firm, for example, payments for wages and salaries, rent, or materials
AI-Robot
concepts of supply in microeconomics
David Reply
economic overview notes
Amahle Reply
identify a demand and a supply curve
Salome Reply
i don't know
Parul
there's a difference
Aryan
Demand curve shows that how supply and others conditions affect on demand of a particular thing and what percent demand increase whith increase of supply of goods
Israr
Hi Sir please how do u calculate Cross elastic demand and income elastic demand?
Abari
Got questions? Join the online conversation and get instant answers!
Jobilize.com Reply
Practice Key Terms 5

Get Jobilize Job Search Mobile App in your pocket Now!

Get it on Google Play Download on the App Store Now


Source:  OpenStax, College algebra. OpenStax CNX. Feb 06, 2015 Download for free at https://legacy.cnx.org/content/col11759/1.3
Google Play and the Google Play logo are trademarks of Google Inc.

Notification Switch

Would you like to follow the 'College algebra' conversation and receive update notifications?

Ask