Given a tabular function, create a new row to represent a horizontal shift.
Identify the input row or column.
Determine the magnitude of the shift.
Add the shift to the value in each input cell.
Shifting a tabular function horizontally
A function
is given in
[link] . Create a table for the function
2
4
6
8
1
3
7
11
The formula
tells us that the output values of
are the same as the output value of
when the input value is 3 less than the original value. For example, we know that
To get the same output from the function
we will need an input value that is 3
larger . We input a value that is 3 larger for
because the function takes 3 away before evaluating the function
We continue with the other values to create
[link] .
5
7
9
11
2
4
6
8
1
3
7
11
1
3
7
11
The result is that the function
has been shifted to the right by 3. Notice the output values for
remain the same as the output values for
but the corresponding input values,
have shifted to the right by 3. Specifically, 2 shifted to 5, 4 shifted to 7, 6 shifted to 9, and 8 shifted to 11.
Identifying a horizontal shift of a toolkit function
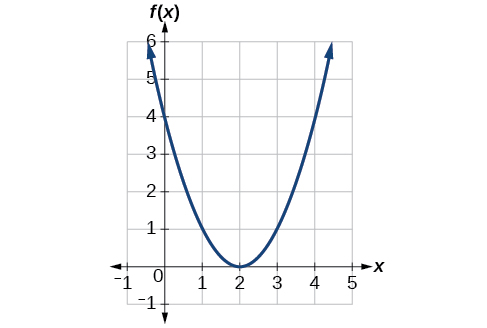
[link] represents a transformation of the toolkit function
Relate this new function
to
and then find a formula for
Notice that the graph is identical in shape to the
function, but the
x- values are shifted to the right 2 units. The vertex used to be at (0,0), but now the vertex is at (2,0). The graph is the basic quadratic function shifted 2 units to the right, so
Notice how we must input the value
to get the output value
the
x -values must be 2 units larger because of the shift to the right by 2 units. We can then use the definition of the
function to write a formula for
by evaluating
The function
gives the number of gallons of gas required to drive
miles. Interpret
and
can be interpreted as adding 10 to the output, gallons. This is the gas required to drive
miles, plus another 10 gallons of gas. The graph would indicate a vertical shift.
can be interpreted as adding 10 to the input, miles. So this is the number of gallons of gas required to drive 10 miles more than
miles. The graph would indicate a horizontal shift.
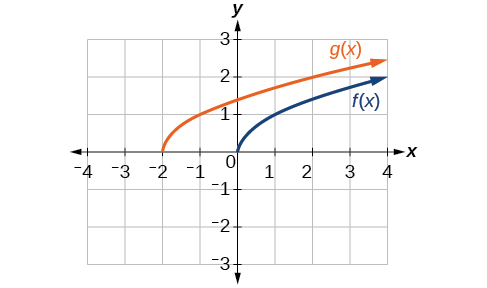
Given the function
graph the original function
and the transformation
on the same axes. Is this a horizontal or a vertical shift? Which way is the graph shifted and by how many units?
The graphs of
and
are shown below. The transformation is a horizontal shift. The function is shifted to the left by 2 units.
Now that we have two transformations, we can combine them. Vertical shifts are outside changes that affect the output (
y -) values and shift the function up or down. Horizontal shifts are inside changes that affect the input (
x -) values and shift the function left or right. Combining the two types of shifts will cause the graph of a function to shift up or down
and left or right.
Step 1: Find the mean. To find the mean, add up all the scores, then divide them by the number of scores. ...
Step 2: Find each score's deviation from the mean. ...
Step 3: Square each deviation from the mean. ...
Step 4: Find the sum of squares. ...
Step 5: Divide the sum of squares by n – 1 or N.
The sample of 16 students is taken. The average age in the sample was 22 years with astandard deviation of 6 years. Construct a 95% confidence interval for the age of the population.
Bhartdarshan' is an internet-based travel agency wherein customer can see videos of the cities they plant to visit. The number of hits daily is a normally distributed random variable with a mean of 10,000 and a standard deviation of 2,400
a. what is the probability of getting more than 12,000 hits?
b. what is the probability of getting fewer than 9,000 hits?
Bhartdarshan'is an internet-based travel agency wherein customer can see videos of the cities they plan to visit. The number of hits daily is a normally distributed random variable with a mean of 10,000 and a standard deviation of 2,400.
a. What is the probability of getting more than 12,000 hits