<< Chapter < Page Chapter >> Page >

Access this online resource for additional instruction and practice with rates of change.

Key equations

Average rate of change Δ y Δ x = f ( x 2 ) f ( x 1 ) x 2 x 1

Key concepts

  • A rate of change relates a change in an output quantity to a change in an input quantity. The average rate of change is determined using only the beginning and ending data. See [link] .
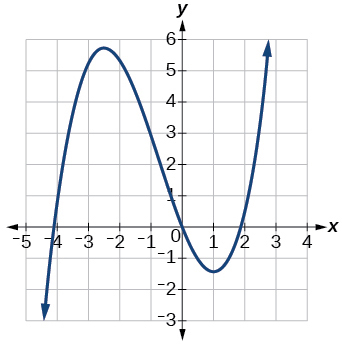
  • Identifying points that mark the interval on a graph can be used to find the average rate of change. See [link] .
  • Comparing pairs of input and output values in a table can also be used to find the average rate of change. See [link] .
  • An average rate of change can also be computed by determining the function values at the endpoints of an interval described by a formula. See [link] and [link] .
  • The average rate of change can sometimes be determined as an expression. See [link] .
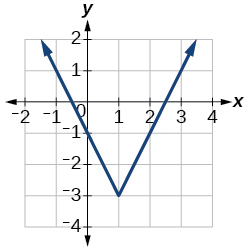
  • A function is increasing where its rate of change is positive and decreasing where its rate of change is negative. See [link] .
  • A local maximum is where a function changes from increasing to decreasing and has an output value larger (more positive or less negative) than output values at neighboring input values.
  • A local minimum is where the function changes from decreasing to increasing (as the input increases) and has an output value smaller (more negative or less positive) than output values at neighboring input values.
  • Minima and maxima are also called extrema.
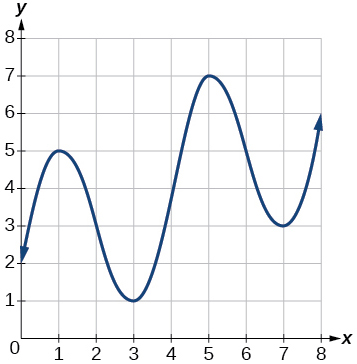
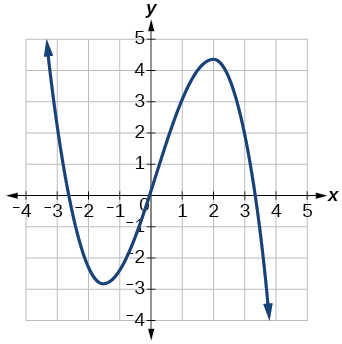
  • We can find local extrema from a graph. See [link] and [link] .
  • The highest and lowest points on a graph indicate the maxima and minima. See [link] .

Section exercises

Verbal

Can the average rate of change of a function be constant?

Yes, the average rate of change of all linear functions is constant.

Got questions? Get instant answers now!

If a function f is increasing on ( a , b ) and decreasing on ( b , c ) , then what can be said about the local extremum of f on ( a , c ) ?

Got questions? Get instant answers now!

How are the absolute maximum and minimum similar to and different from the local extrema?

The absolute maximum and minimum relate to the entire graph, whereas the local extrema relate only to a specific region around an open interval.

Got questions? Get instant answers now!

How does the graph of the absolute value function compare to the graph of the quadratic function, y = x 2 , in terms of increasing and decreasing intervals?

Got questions? Get instant answers now!

Algebraic

For the following exercises, find the average rate of change of each function on the interval specified for real numbers b or h in simplest form.

f ( x ) = 4 x 2 7 on [ 1 ,   b ]

4 ( b + 1 )

Got questions? Get instant answers now!

g ( x ) = 2 x 2 9 on [ 4 ,   b ]

Got questions? Get instant answers now!

p ( x ) = 3 x + 4 on [ 2 ,   2 + h ]

3

Got questions? Get instant answers now!

k ( x ) = 4 x 2 on [ 3 ,   3 + h ]

Got questions? Get instant answers now!

f ( x ) = 2 x 2 + 1 on [ x , x + h ]

4 x + 2 h

Got questions? Get instant answers now!

g ( x ) = 3 x 2 2 on [ x , x + h ]

Got questions? Get instant answers now!

a ( t ) = 1 t + 4 on [ 9 , 9 + h ]

1 13 ( 13 + h )

Got questions? Get instant answers now!

b ( x ) = 1 x + 3 on [ 1 , 1 + h ]

Got questions? Get instant answers now!

j ( x ) = 3 x 3 on [ 1 , 1 + h ]

3 h 2 + 9 h + 9

Got questions? Get instant answers now!

r ( t ) = 4 t 3 on [ 2 , 2 + h ]

Got questions? Get instant answers now!

f ( x + h ) f ( x ) h given f ( x ) = 2 x 2 3 x on [ x , x + h ]

4 x + 2 h 3

Got questions? Get instant answers now!

Graphical

For the following exercises, consider the graph of f shown in [link] .

Graph of a polynomial.

Estimate the average rate of change from x = 1 to x = 4.

Got questions? Get instant answers now!

Estimate the average rate of change from x = 2 to x = 5.

4 3

Got questions? Get instant answers now!

For the following exercises, use the graph of each function to estimate the intervals on which the function is increasing or decreasing.

Graph of a cubic function.

increasing on ( , 2.5 ) ( 1 , ) , decreasing on ( 2.5 ,   1 )

Got questions? Get instant answers now!
Graph of a reciprocal function.

increasing on ( , 1 ) ( 3 , 4 ) , decreasing on ( 1 , 3 ) ( 4 , )

Got questions? Get instant answers now!

For the following exercises, consider the graph shown in [link] .

Questions & Answers

how do you get the 2/50
Abba Reply
number of sport play by 50 student construct discrete data
Aminu Reply
width of the frangebany leaves on how to write a introduction
Theresa Reply
Solve the mean of variance
Veronica Reply
Step 1: Find the mean. To find the mean, add up all the scores, then divide them by the number of scores. ... Step 2: Find each score's deviation from the mean. ... Step 3: Square each deviation from the mean. ... Step 4: Find the sum of squares. ... Step 5: Divide the sum of squares by n – 1 or N.
kenneth
what is error
Yakuba Reply
Is mistake done to something
Vutshila
Hy
anas
hy
What is the life teble
anas
hy
Jibrin
statistics is the analyzing of data
Tajudeen Reply
what is statics?
Zelalem Reply
how do you calculate mean
Gloria Reply
diveving the sum if all values
Shaynaynay
let A1,A2 and A3 events be independent,show that (A1)^c, (A2)^c and (A3)^c are independent?
Fisaye Reply
what is statistics
Akhisani Reply
data collected all over the world
Shaynaynay
construct a less than and more than table
Imad Reply
The sample of 16 students is taken. The average age in the sample was 22 years with astandard deviation of 6 years. Construct a 95% confidence interval for the age of the population.
Aschalew Reply
Bhartdarshan' is an internet-based travel agency wherein customer can see videos of the cities they plant to visit. The number of hits daily is a normally distributed random variable with a mean of 10,000 and a standard deviation of 2,400 a. what is the probability of getting more than 12,000 hits? b. what is the probability of getting fewer than 9,000 hits?
Akshay Reply
Bhartdarshan'is an internet-based travel agency wherein customer can see videos of the cities they plan to visit. The number of hits daily is a normally distributed random variable with a mean of 10,000 and a standard deviation of 2,400. a. What is the probability of getting more than 12,000 hits
Akshay
1
Bright
Sorry i want to learn more about this question
Bright
Someone help
Bright
a= 0.20233 b=0.3384
Sufiyan
a
Shaynaynay
How do I interpret level of significance?
Mohd Reply
It depends on your business problem or in Machine Learning you could use ROC- AUC cruve to decide the threshold value
Shivam
how skewness and kurtosis are used in statistics
Owen Reply
yes what is it
Taneeya
Got questions? Join the online conversation and get instant answers!
Jobilize.com Reply
Practice Key Terms 9

Get Jobilize Job Search Mobile App in your pocket Now!

Get it on Google Play Download on the App Store Now


Source:  OpenStax, Algebra and trigonometry. OpenStax CNX. Nov 14, 2016 Download for free at https://legacy.cnx.org/content/col11758/1.6
Google Play and the Google Play logo are trademarks of Google Inc.

Notification Switch

Would you like to follow the 'Algebra and trigonometry' conversation and receive update notifications?

Ask