<< Chapter < Page Chapter >> Page >
In this section you will:
  • Plot ordered pairs in a Cartesian coordinate system.
  • Graph equations by plotting points.
  • Graph equations with a graphing utility.
  • Find x -intercepts and y -intercepts.
  • Use the distance formula.
  • Use the midpoint formula.
Road map of a city with street names on an x, y coordinate grid. Various points are marked in red on the grid lines indicating different locations on the map.

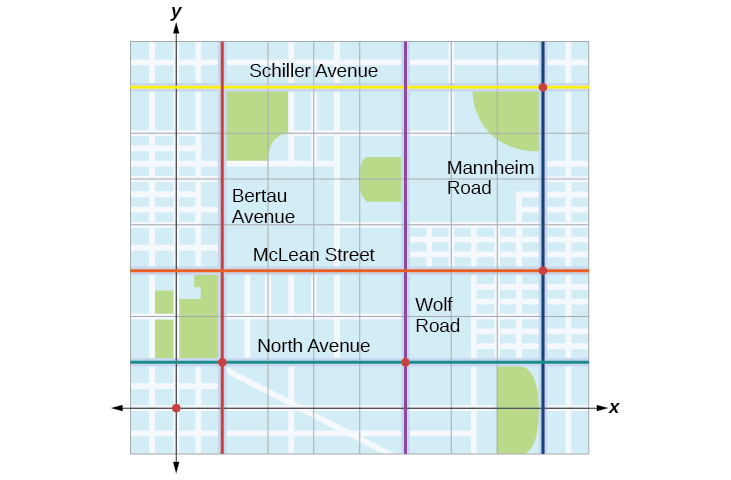
Tracie set out from Elmhurst, IL, to go to Franklin Park. On the way, she made a few stops to do errands. Each stop is indicated by a red dot in [link] . Laying a rectangular coordinate grid over the map, we can see that each stop aligns with an intersection of grid lines. In this section, we will learn how to use grid lines to describe locations and changes in locations.

Plotting ordered pairs in the cartesian coordinate system

An old story describes how seventeenth-century philosopher/mathematician René Descartes invented the system that has become the foundation of algebra while sick in bed. According to the story, Descartes was staring at a fly crawling on the ceiling when he realized that he could describe the fly’s location in relation to the perpendicular lines formed by the adjacent walls of his room. He viewed the perpendicular lines as horizontal and vertical axes. Further, by dividing each axis into equal unit lengths, Descartes saw that it was possible to locate any object in a two-dimensional plane using just two numbers—the displacement from the horizontal axis and the displacement from the vertical axis.

While there is evidence that ideas similar to Descartes’ grid system existed centuries earlier, it was Descartes who introduced the components that comprise the Cartesian coordinate system    , a grid system having perpendicular axes. Descartes named the horizontal axis the x- axis and the vertical axis the y- axis .

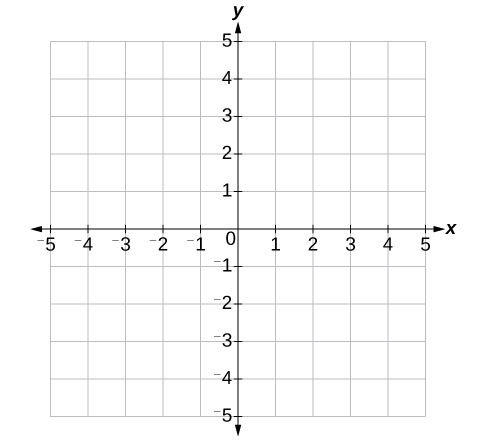
The Cartesian coordinate system, also called the rectangular coordinate system, is based on a two-dimensional plane consisting of the x -axis and the y -axis. Perpendicular to each other, the axes divide the plane into four sections. Each section is called a quadrant    ; the quadrants are numbered counterclockwise as shown in [link]

This is an image of an x, y plane with the axes labeled. The upper right section is labeled: Quadrant I.  The upper left section is labeled: Quadrant II.  The lower left section is labeled: Quadrant III.  The lower right section is labeled: Quadrant IV.

The center of the plane is the point at which the two axes cross. It is known as the origin    , or point ( 0 , 0 ) . From the origin, each axis is further divided into equal units: increasing, positive numbers to the right on the x- axis and up the y- axis; decreasing, negative numbers to the left on the x- axis and down the y- axis. The axes extend to positive and negative infinity as shown by the arrowheads in [link] .

This is an image of an x, y coordinate plane.  The x and y axis range from negative 5 to 5.

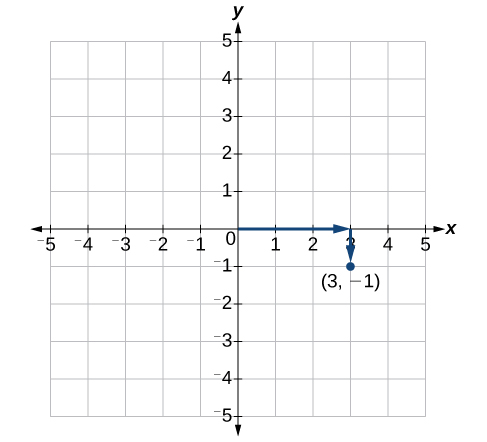
Each point in the plane is identified by its x- coordinate    , or horizontal displacement from the origin, and its y- coordinate    , or vertical displacement from the origin. Together, we write them as an ordered pair    indicating the combined distance from the origin in the form ( x , y ) . An ordered pair is also known as a coordinate pair because it consists of x- and y -coordinates. For example, we can represent the point ( 3 , −1 ) in the plane by moving three units to the right of the origin in the horizontal direction, and one unit down in the vertical direction. See [link] .

This is an image of an x, y coordinate plane. The x and y axis range from negative 5 to 5.  The point (3, -1) is labeled.  An arrow extends rightward from the origin 3 units and another arrow extends downward one unit from the end of that arrow to the point.

When dividing the axes into equally spaced increments, note that the x- axis may be considered separately from the y- axis. In other words, while the x- axis may be divided and labeled according to consecutive integers, the y- axis may be divided and labeled by increments of 2, or 10, or 100. In fact, the axes may represent other units, such as years against the balance in a savings account, or quantity against cost, and so on. Consider the rectangular coordinate system primarily as a method for showing the relationship between two quantities.

Questions & Answers

Ayele, K., 2003. Introductory Economics, 3rd ed., Addis Ababa.
Widad Reply
can you send the book attached ?
Ariel
?
Ariel
What is economics
Widad Reply
the study of how humans make choices under conditions of scarcity
AI-Robot
U(x,y) = (x×y)1/2 find mu of x for y
Desalegn Reply
U(x,y) = (x×y)1/2 find mu of x for y
Desalegn
what is ecnomics
Jan Reply
this is the study of how the society manages it's scarce resources
Belonwu
what is macroeconomic
John Reply
macroeconomic is the branch of economics which studies actions, scale, activities and behaviour of the aggregate economy as a whole.
husaini
etc
husaini
difference between firm and industry
husaini Reply
what's the difference between a firm and an industry
Abdul
firm is the unit which transform inputs to output where as industry contain combination of firms with similar production 😅😅
Abdulraufu
Suppose the demand function that a firm faces shifted from Qd  120 3P to Qd  90  3P and the supply function has shifted from QS  20  2P to QS 10  2P . a) Find the effect of this change on price and quantity. b) Which of the changes in demand and supply is higher?
Toofiq Reply
explain standard reason why economic is a science
innocent Reply
factors influencing supply
Petrus Reply
what is economic.
Milan Reply
scares means__________________ends resources. unlimited
Jan
economics is a science that studies human behaviour as a relationship b/w ends and scares means which have alternative uses
Jan
calculate the profit maximizing for demand and supply
Zarshad Reply
Why qualify 28 supplies
Milan
what are explicit costs
Nomsa Reply
out-of-pocket costs for a firm, for example, payments for wages and salaries, rent, or materials
AI-Robot
concepts of supply in microeconomics
David Reply
economic overview notes
Amahle Reply
identify a demand and a supply curve
Salome Reply
i don't know
Parul
there's a difference
Aryan
Demand curve shows that how supply and others conditions affect on demand of a particular thing and what percent demand increase whith increase of supply of goods
Israr
Hi Sir please how do u calculate Cross elastic demand and income elastic demand?
Abari
Got questions? Join the online conversation and get instant answers!
Jobilize.com Reply

Get Jobilize Job Search Mobile App in your pocket Now!

Get it on Google Play Download on the App Store Now


Source:  OpenStax, Algebra and trigonometry. OpenStax CNX. Nov 14, 2016 Download for free at https://legacy.cnx.org/content/col11758/1.6
Google Play and the Google Play logo are trademarks of Google Inc.

Notification Switch

Would you like to follow the 'Algebra and trigonometry' conversation and receive update notifications?

Ask