This module introduces tree diagrams as a method for making some probability problems easier to solve. This module is included in the Elementary Statistics textbook/collection as an optional lesson.
A
tree diagram is a special type of graph used to determine the outcomes of an experiment. It consists of "branches" that are labeled with either frequencies or probabilities. Tree diagrams can make some probability problems easier to visualize and solve. The following example illustrates how to use a tree diagram.
In an urn, there are 11 balls. Three balls are red (
) and 8 balls are blue (
). Draw two balls, one at a time,
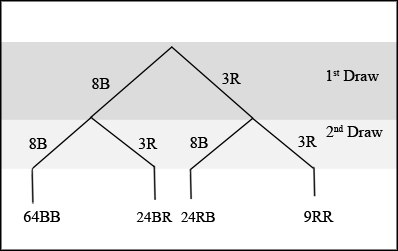
with replacement . "With replacement" means that you put the first ball back in the urn before you select the second ball. The tree diagram using frequencies that show all the possible outcomes follows.
The first set of branches represents the first draw. The second set of branches represents the second draw. Each of the outcomes is distinct. In fact, we can list each red ball as
,
, and
and each blue ball as
,
,
,
,
,
,
, and
. Then the 9
outcomes can be written as:
The other outcomes are similar.
There are a total of 11 balls in the urn. Draw two balls, one at a time, and with replacement. There are
outcomes, the size of the
sample space .
This problem is a conditional. The sample space has been reduced to those outcomes that already have a blue on the first draw. There are
possible outcomes (24
and 64
). Twenty-four of the 88 possible outcomes are
.
.
There are
outcomes that have
on the first draw (9
and 24
). The sample space is then
. Twenty-four of the 33 outcomes have
on the second draw. The probability is then
.
An urn has 3 red marbles and 8 blue marbles in it. Draw two marbles, one at a time, this time without replacement from the urn.
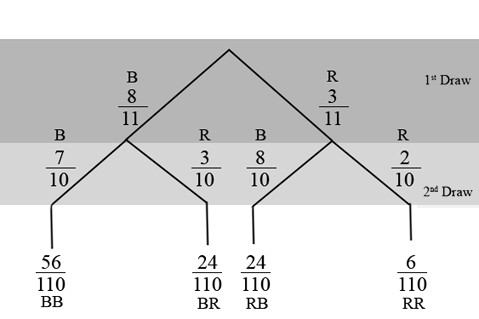
"Without replacement" means that you do not put the first ball back before you select the second ball. Below is a tree diagram. The branches are labeled with probabilities instead of frequencies. The numbers at the ends of the branches are calculated by multiplying the numbers on the two corresponding branches, for example,
.
If you draw a red on the first draw from the 3 red possibilities, there are 2 red left to draw on the second draw. You do not put back or replace the first ball after you have drawn it. You draw
without replacement , so that on the second draw there are 10 marbles left in the urn.
Calculate the following probabilities using the tree diagram.
There are
outcomes that have
on the first draw (6
and 24
). The 6 and the 24 are frequencies. They are also the numerators of the fractions
and
. The sample space is no longer 110 but
. Twenty-four of the 30 outcomes have
on the second draw. The probability is then
. Did you get this answer?
A golfer on a fairway is 70 m away from the green, which sits below the level of the fairway by 20 m. If the golfer hits the ball at an angle of 40° with an initial speed of 20 m/s, how close to the green does she come?
A mouse of mass 200 g falls 100 m down a vertical mine shaft and lands at the bottom with a speed of 8.0 m/s. During its fall, how much work is done on the mouse by air resistance
Chemistry is a branch of science that deals with the study of matter,it composition,it structure and the changes it undergoes
Adjei
please, I'm a physics student and I need help in physics
Adjanou
chemistry could also be understood like the sexual attraction/repulsion of the male and female elements. the reaction varies depending on the energy differences of each given gender. + masculine -female.
Pedro
A ball is thrown straight up.it passes a 2.0m high window 7.50 m off the ground on it path up and takes 1.30 s to go past the window.what was the ball initial velocity
2. A sled plus passenger with total mass 50 kg is pulled 20 m across the snow (0.20) at constant velocity by a force directed 25° above the horizontal. Calculate (a) the work of the applied force, (b) the work of friction, and (c) the total work.
you have been hired as an espert witness in a court case involving an automobile accident. the accident involved car A of mass 1500kg which crashed into stationary car B of mass 1100kg. the driver of car A applied his brakes 15 m before he skidded and crashed into car B. after the collision, car A s
can someone explain to me, an ignorant high school student, why the trend of the graph doesn't follow the fact that the higher frequency a sound wave is, the more power it is, hence, making me think the phons output would follow this general trend?
Nevermind i just realied that the graph is the phons output for a person with normal hearing and not just the phons output of the sound waves power, I should read the entire thing next time
Joseph
Follow up question, does anyone know where I can find a graph that accuretly depicts the actual relative "power" output of sound over its frequency instead of just humans hearing
Joseph
"Generation of electrical energy from sound energy | IEEE Conference Publication | IEEE Xplore" ***ieeexplore.ieee.org/document/7150687?reload=true
A string is 3.00 m long with a mass of 5.00 g. The string is held taut with a tension of 500.00 N applied to the string. A pulse is sent down the string. How long does it take the pulse to travel the 3.00 m of the string?